 155x28:57
High Tide ($HITI) CEO Raj Grover Interview
54K views · 1 year ago


@chartreadersFinancial MarketsUnited StatesView on YouTube
The Chart Readers has 6,770 subscribers and 473K views in Financial Markets. A typical video gets 264 views. Its top outlier, “High Tide ($HITI) CEO Raj Grover Interview”, did 155x the channel’s usual views.
Data as of
6,770
Subscribers
473K
Total views
+1,535 in 73 days
264
Median views per video
average 424
1,300
Videos
~0.8 uploads a week
Last 29 days with a reading.
Lifetime views, per reading.
The videos that most beat the channel's own usual views.
155x28:5754K views · 1 year ago
 6.7x9:51
865 views · 4 years ago
 6.6x18:51
2.1K views · 1 year ago
 6x20:19
1.8K views · 2 years ago
 5.4x12:14
836 views · 3 years ago
 5.1x24:53
1.8K views · 2 years ago
 4.9x11:02
1K views · 2 years ago
 4.5x16:35
1K views · 3 years ago
 4.3x20:36
1.3K views · 2 years ago
 4.2x8:32
885 views · 3 years ago
 4.1x16:25
3.4K views · 1 year ago
 3.8x19:14
6.4K views · 1 year ago
 0.2x
42 views · 1 day ago
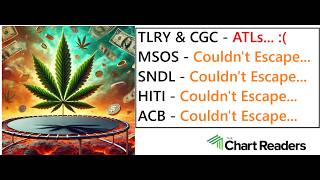 2.7x
503 views · 5 days ago
 0.9x
179 views · 1 week ago
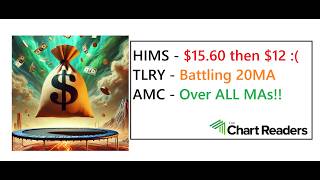 0.8x
149 views · 1 week ago
 1.3x4:06
190 views · 3 weeks ago
 3x15:27
489 views · 2 months ago
 3.7x27:27
605 views · 3 months ago
 0.7x20:49
109 views · 3 months ago
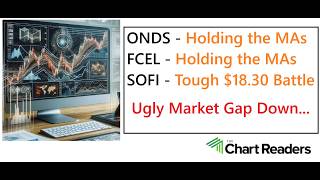 0.9x15:55
137 views · 3 months ago
 0.8x17:18
122 views · 3 months ago
 2.7x23:37
364 views · 3 months ago
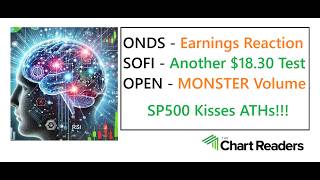 0.8x18:29
105 views · 3 months ago
Want more? Hugo searches TubeAI’s database for channels like The Chart Readers.
Before my trading profession reached the next level, there was very little strategy to my portfolio. I would add money into my online account, hope the right stock was purchased, and really that was it – no plans on when to buy more, no plans to take some profit, no idea what to do if the stock crashes, nothing. Not Any More! No more: hoping, wishing, praying, panic selling... I owe the above to understanding Technical Analysis, and my goal is to simplify my personal indicator stack. With strong dedication to a few simple indicators and rules, it is much easier to gauge risk tolerances with your stocks. Moving Averages, Support Lines, Resistance Lines, MACD, RSI, and Volume indicators are all used in conjunction to make educated price predictions - both up and down NOTHING is Financial Advice, including but not limited to: my videos, my comments/responses, your comments/responses We are Simply Educated People Sharing Our Thoughts and Opinions I AM SO GRATEFUL FOR YOUR TIME!!!
In TubeAI
Opens Hugo on this channel · free to start · no card
Ask Hugo why a video took off, which ideas would work for your channel, and what to title it — backed by YouTube Explorer data on The Chart Readers and the channels around it.


