
Tech YouTube benchmarks: views, growth and upload pace by channel size
A typical tech channel with 10K-100K subscribers averages 17,959 views per video, about 60% more than channels that size in other niches. Here is the full benchmark by channel size, sub-niche, video length and title format.

A typical tech YouTube channel with 10K-100K subscribers averages 17,959 views per video, uploads a long-form video about once every 13 days, and gains roughly 0.8% more subscribers per month. Those are the medians I pulled today across 3,046 active tech creator channels in the TubeAI database. That is about 60% more views than a typical channel the same size in other niches, from the same upload pace. The lead is biggest for small channels and gone by a million subscribers. Below is the full benchmark by channel size, by tech sub-niche, by video length and by title format, so you can see where your own channel sits.
- 3,311tech creator channels3,071 uploaded in the last 180 days
- 17,959median views per videochannels with 10K-100K subscribers
- 0.80%median subscriber growthper 30 days, 10K-100K channels
- 0.54long-form uploads per weeksame as the all-niche median
How I built these benchmarks
Our database classifies channels by niche. This post covers the Tech niche: gadget reviews, setups, new products, retro hardware and tech news, 3,311 genuine creator channels approved for the app, 3,071 of them with a long-form upload in the last 180 days. For the size benchmarks I kept the 3,046 active channels with at least 1,000 subscribers, so dormant channels do not drag the numbers down. Two related niches are tracked separately, Software Development and AI & Machine Learning, and I show them alongside for comparison.
Two terms come up below. Average views is each channel's average views per video; the benchmark is the median of those averages, because a few huge channels would wreck an average. A breakout is a video that got at least 2x its own channel's typical views, which lets a small channel's hit count as much as a big channel's.
Tech benchmarks by channel size
Half of active tech channels sit in the middle: 1,549 have 10K-100K subscribers, 748 have 1K-10K, 658 have 100K-1M and 91 have passed a million.
| Subscribers | Channels | Median avg views | Views per subscriber | Uploads per week |
|---|---|---|---|---|
| 1K-10K | 748 | 8,354 | 1.25 | 0.39 |
| 10K-100K | 1,549 | 17,959 | 0.65 | 0.54 |
| 100K-1M | 658 | 69,429 | 0.27 | 0.78 |
| 1M+ | 91 | 358,065 | 0.15 | 1.01 |
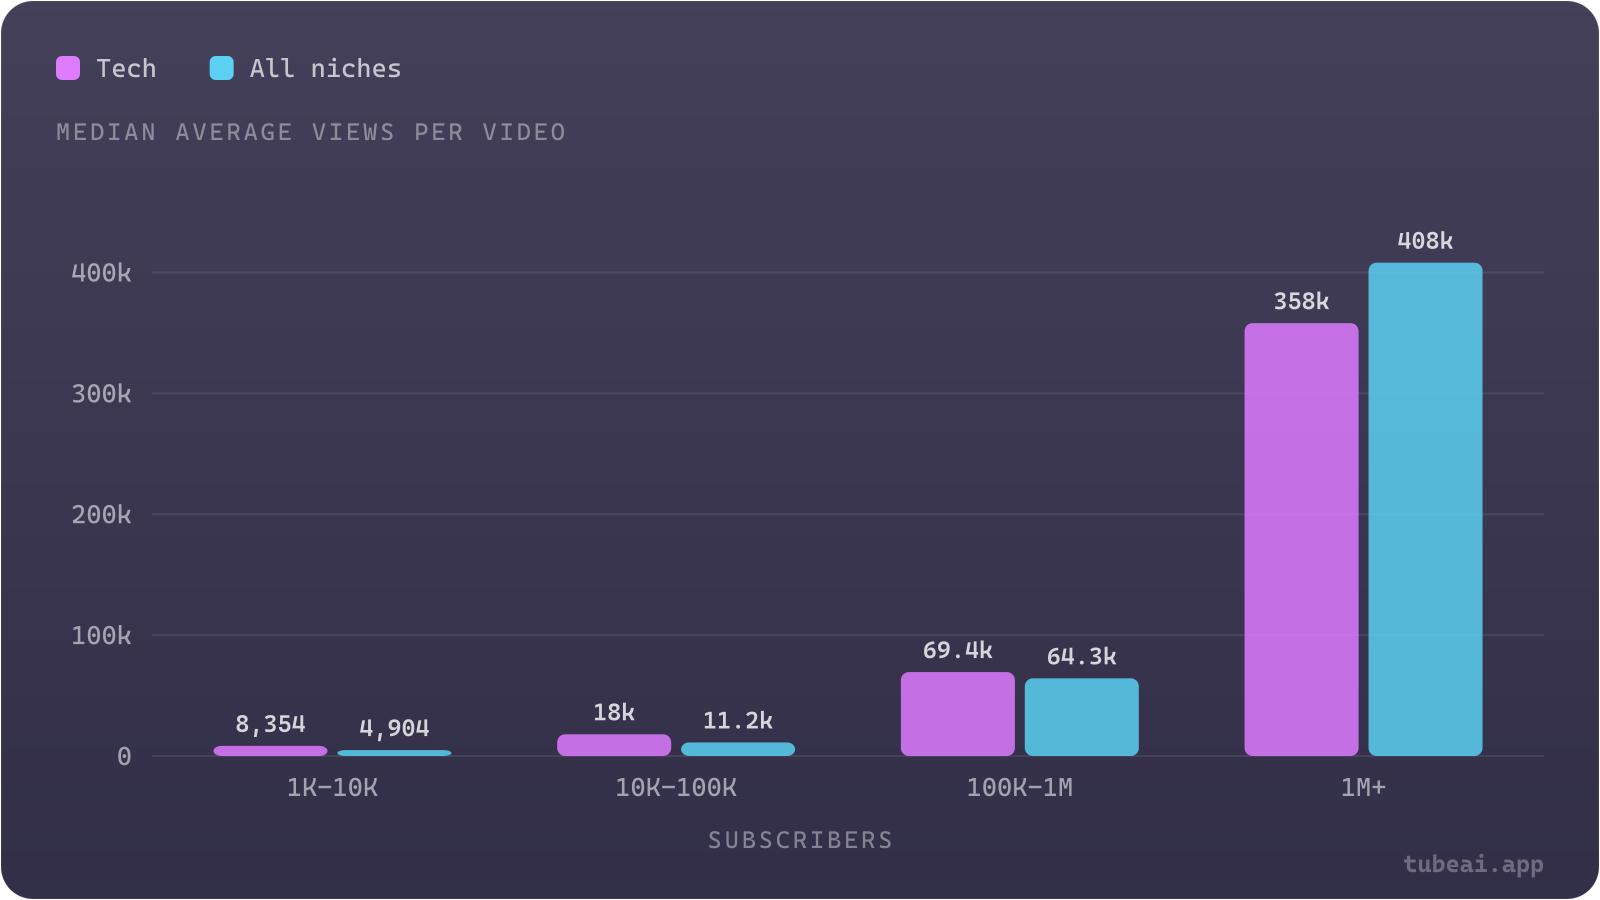
Chart data
| Subscribers | tech | all_niches |
|---|---|---|
| 1K-10K | 8,354 | 4,904 |
| 10K-100K | 17,959 | 11,207 |
| 100K-1M | 69,429 | 64,254 |
| 1M+ | 358,065 | 408,063 |
Three things stand out.
- Small tech channels get more views than their size suggests. At 1K-10K subscribers the median tech channel averages 8,354 views per video, against 4,904 across all niches, about 70% more. At 10K-100K it is 17,959 against 11,207. A tech video is often found by someone searching for a specific product or problem, not by a subscriber, so views are less tied to subscriber count.
- The advantage fades as channels grow. At 100K-1M tech leads by only 8% (69,429 vs 64,254), and at 1M+ the median tech channel averages 358,065 views per video, 12% below the all-niche median of 408,063. Views per subscriber fall from 1.25 at 1K-10K to 0.15 at 1M+; across all niches the drop is from 0.74 to 0.20.
- Bigger tech channels post more often. The median 1K-10K tech channel posts 0.39 long-form videos a week, about one every 18 days, while 1M+ channels post 1.01 a week. Across all niches the median is 0.54 at every size. The biggest tech channels keep up with a constant flow of launches and leaks.
If you compare a small tech channel with a general benchmark, you may think you are ahead when you are only average for tech. Use the tech table for your band.
| Subscribers | Tech avg views | Software Dev avg views | AI & ML avg views | All niches avg views |
|---|---|---|---|---|
| 1K-10K | 8,354 | 5,596 | 4,506 | 4,904 |
| 10K-100K | 17,959 | 13,917 | 10,649 | 11,207 |
| 100K-1M | 69,429 | 54,214 | 45,231 | 64,254 |
| 1M+ | 358,065 | 218,658 | 148,789 | 408,063 |
The broader tech family splits clearly. Consumer tech leads at every size. Software development channels sit in between, ahead of the all-niche median below 100K subscribers, and post the least: 0.35-0.39 long-form videos a week below a million subscribers, about one every 18-20 days. AI and machine learning channels get the fewest views of the three at every size, 10,649 per video at 10K-100K, while posting more often than any of them at 0.78 a week.
Subscriber growth: tech grows at about the YouTube average
To measure growth I compared each channel's subscriber count at the start and end of a 30-day window, Oct 17-Nov 16 2026, and scaled it to exactly 30 days. I only used channels with 10K-100K subscribers, because smaller channels grow faster in percentage terms and would skew any comparison between niches.
Across 1,509 tech channels that size, the median grew 0.80% per 30 days. Across 85,648 channels that size in every niche, the median was 0.74%. Tech has slightly fewer fast growers (12.0% of channels grew 5% or more, against 13.1% overall) but noticeably fewer stalled ones: 24.6% stayed flat or lost subscribers, against 29.9% across all niches.
This is a single month, so treat it as a snapshot, not a forecast. YouTube also rounds subscriber counts, which hides small moves on bigger channels. For growth across every niche and channel size, see how fast YouTube channels grow.
Benchmarks by tech sub-niche
Tech covers very different kinds of channel. These are the sub-niches with at least 100 active channels in the database; a channel can carry more than one, and most tech channels are tagged as reviewers.
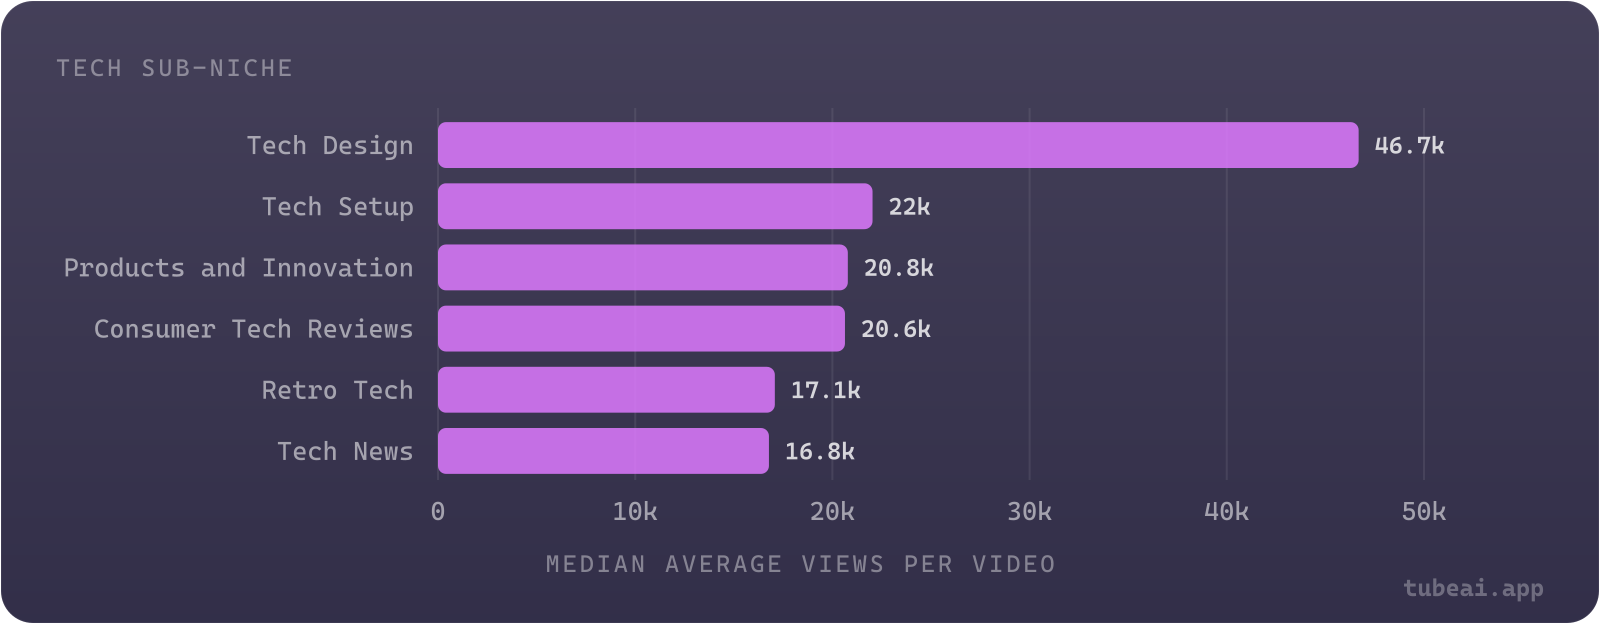
Chart data
| Tech sub-niche | Median average views per video |
|---|---|
| Tech Design | 46,686 |
| Tech Setup | 22,035 |
| Products and Innovation | 20,782 |
| Consumer Tech Reviews | 20,637 |
| Retro Tech | 17,081 |
| Tech News | 16,782 |
| Sub-niche | Active channels | Median avg views | Views per subscriber | Uploads per week |
|---|---|---|---|---|
| Consumer Tech Reviews | 2,553 | 20,637 | 0.60 | 0.54 |
| Products and Innovation | 1,330 | 20,782 | 0.52 | 0.54 |
| Tech Setup | 1,110 | 22,035 | 0.69 | 0.47 |
| Retro Tech | 684 | 17,081 | 0.79 | 0.39 |
| Tech News | 300 | 16,782 | 0.30 | 1.01 |
| Tech Design | 107 | 46,686 | 0.94 | 0.23 |
Reviews, products and setups dominate the niche and land close together, at roughly 20,000-22,000 views per video. Tech news is the outlier on effort: its channels post 1.01 long-form videos a week, about twice the tech median, yet get the fewest views per video (16,782) and only 0.30 views per subscriber. News is old within days, so each video has a short life.
Tech design (industrial design, how products are made) is the standout: only 107 active channels, a median of 46,686 views per video and 0.94 views per subscriber, from the slowest pace in tech, about one video every month. Retro tech follows the same pattern on a smaller scale: 0.79 views per subscriber from 0.39 uploads a week. Slow, crafted videos about things that do not go out of date keep earning.
Does video length matter in tech?
Yes, and the sweet spot is in the middle. I looked at 112,905 long-form tech videos (3 minutes or longer) published between Oct 2025 and Sep 2026 by active channels with 10K-1M subscribers, and measured how often each length band broke out.
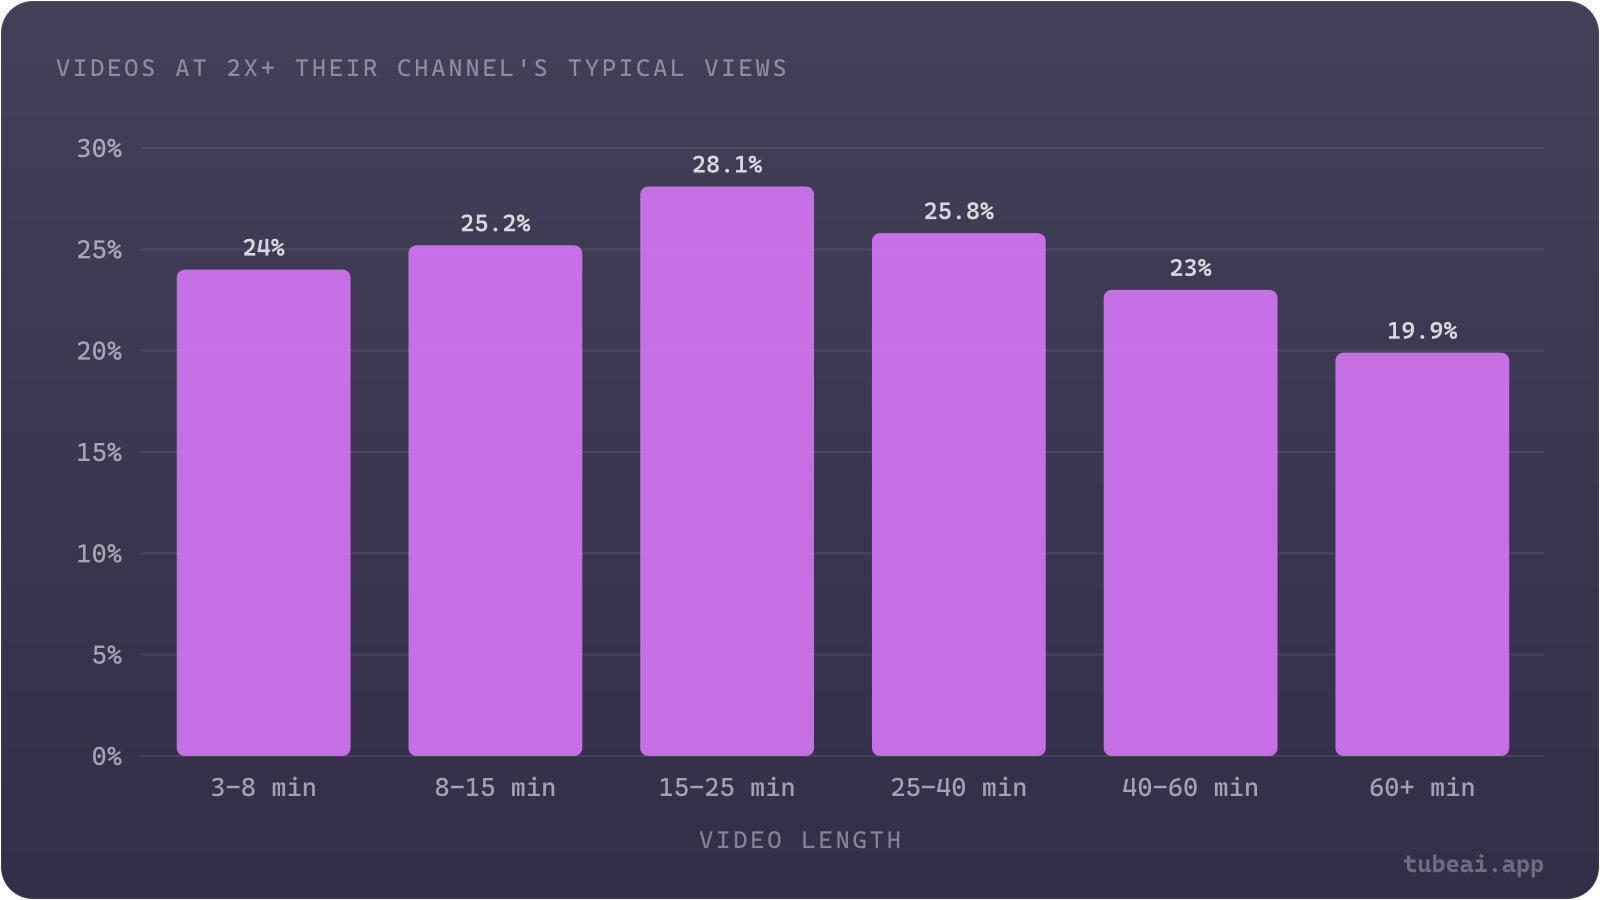
Chart data
| Video length | Videos at 2x+ their channel's typical views (%) |
|---|---|
| 3-8 min | 24 |
| 8-15 min | 25.2 |
| 15-25 min | 28.1 |
| 25-40 min | 25.8 |
| 40-60 min | 23 |
| 60+ min | 19.9 |
Breakout rates rise from 24.0% at 3-8 minutes to a peak of 28.1% at 15-25 minutes, then fall to 19.9% past an hour. The median video follows the same curve, from 0.96x its channel's normal views at 3-8 minutes to 1.12x at 15-25 minutes. That is long enough for a full review or a setup walkthrough without padding.
Tech sits between the other niches I have measured. In finance, breakout rates keep climbing past an hour; in gaming, every length breaks out at a similar rate. The most common tech length, 8-15 minutes (44,067 videos), sits just below the peak, so the gap is small. If most of your videos run 10 minutes, a longer version of your best topic is worth testing, not a different format.
The title formats behind tech breakouts
Our title-format dataset holds 12,153 tech videos from 1,571 channels that each got at least 2x their channel's normal views, published Sep 2025 to Nov 2026. The median among them is 3.55x. These are the formats the most channels used:
| Title format | Channels | Videos | Median multiplier |
|---|---|---|---|
| [thing] vs [thing] | 193 | 371 | 3.11x |
| My Honest Review of [thing] | 175 | 268 | 3.66x |
| How to Fix [thing] | 101 | 188 | 4.54x |
| How to Install [thing] on Any [thing] (Easy Setup Guide) | 98 | 205 | 3.98x |
| [thing] After [duration]: Still Worth It? | 90 | 134 | 3.21x |
| Is [thing] Worth It? | 89 | 111 | 3.43x |
| [thing] Unboxing & First Impressions! | 87 | 162 | 3.14x |
| [thing] Review ([year]) | 86 | 113 | 2.38x |
| How to Use [thing] | 80 | 206 | 4.85x |
| [thing] Is Finally Here | 71 | 95 | 2.86x |
| [thing]: An Honest [duration] Review | 65 | 100 | 3.69x |
| Everything New in [thing] | 55 | 125 | 3.51x |
| First Look at [thing] | 54 | 99 | 3.07x |
| [thing] vs [thing] Comparison | 53 | 71 | 3.42x |
| The Best [thing] for [topic] | 50 | 56 | 3.35x |
| Which [thing] Should You Buy? | 50 | 64 | 3.20x |
| How to Fix [thing] Not Working | 48 | 202 | 4.71x |
Comparisons and reviews are the most common: "[thing] vs [thing]" breakouts came from 193 channels and "My Honest Review of [thing]" from 175. But the formats that go furthest solve a problem: "How to Use [thing]" (4.85x), "How to Fix [thing] Not Working" (4.71x) and "How to Fix [thing]" (4.54x) all sit well above the 3.55x median. People search for these when something is in front of them and not working, and they keep searching long after launch week.
Launch titles sit at the bottom: "[thing] Is Finally Here" at 2.86x, "[thing]: Everything You Need to Know" at 2.73x and "[thing] Review ([year])" at 2.38x. Every reviewer publishes these at the same moment, so they compete with each other. The reviews that do better add something the launch-day crowd cannot have, like time with the product ("An Honest [duration] Review", 3.69x) or a personal verdict. All of these videos already broke out, so this ranks formats among winners; it does not say how often each one fails. For the cross-niche ranking, see the best YouTube title formats, ranked by data.
How to use these benchmarks on your own channel
Compare against tech, not YouTube
Small tech channels get about 60-70% more views than other niches at the same size. Use the tech table for your band, or you may think you are ahead when you are average.
Check views per subscriber
Divide your average views by your subscribers. At 10K-100K the tech median is 0.65. Far below it means your videos rely on subscribers rather than search, and fewer new viewers are finding them.
Benchmark within your sub-niche
A tech news channel and a tech design channel should not chase the same numbers. Use the sub-niche table for a fairer target.
Aim for 15-25 minutes on your best topics
That band breaks out most often in tech. Past an hour the breakout rate falls to 19.9%.
Add a how-to to every launch
Launch-day reviews compete with everyone else's. A 'How to use' or 'How to fix' video on the same product keeps getting searched after launch week.
For a view benchmark across every niche, see how many views is good on YouTube.
Tech YouTube benchmarks: common questions
How many views does a typical tech YouTube channel get?
It depends on size. Among active tech channels in the TubeAI database, the median channel averages 8,354 views per video at 1K-10K subscribers, 17,959 at 10K-100K, 69,429 at 100K-1M and 358,065 at 1M+.
Do tech channels get more views than other niches?
Below 1M subscribers, yes. At 10K-100K the median tech channel averages 17,959 views per video, against 11,207 across all niches. The gap narrows to 8% at 100K-1M, and at 1M+ tech channels average 12% fewer views than the all-niche median.
How often do tech YouTubers upload?
The median active tech channel posts 0.39 long-form videos a week at 1K-10K subscribers, 0.54 at 10K-100K, 0.78 at 100K-1M and 1.01 at 1M+. Tech news channels post about one a week. Shorts are not counted.
What is the best video length for tech YouTube?
15-25 minutes. 28.1% of tech videos that length reach 2x their channel's typical views, against 24.0% at 3-8 minutes and 19.9% for videos over an hour.
Which tech sub-niche gets the most views?
Among sub-niches with 100+ active channels, tech design has the highest median at 46,686 views per video. Setup, product and review channels sit at about 21,000-22,000; tech news is lowest at 16,782.