
The best time to post on YouTube, measured on 209,096 uploads
Publish time barely moves the odds of a breakout. The best hour beats the worst by 2.3 points, the quiet overnight hours edge out the crowded afternoon, and sticking to your usual slot keeps results steady.

There is no best time to post on YouTube that changes much. I measured 209,096 long-form uploads with exact publish times and compared each one's views after 7 days with its own channel's median. The best hour (04:00 UTC) produced a breakout, double the channel's usual 7-day views, 14.6% of the time. The worst hour (14:00 UTC) did it 12.3% of the time. That is a 2.3-point gap across the whole day. The quiet overnight hours do slightly better than the crowded afternoon, Saturday does slightly better than Wednesday, and posting at your usual time keeps your results steadier. None of it matters as much as the video itself.
- 2.3 ptsBest hour vs worst hourBreakout share, 04:00 vs 14:00 UTC
- 13.2%Uploads that broke out2x the channel's median 7-day views
- 5.6xBusiest vs quietest hourUploads at 16:00 vs 06:00 UTC
- 1.6 ptsSaturday vs Wednesday14.4% vs 12.7% breakout share
How I measured it
Most posting-time studies have a hidden flaw: the publish times are not real. Large video datasets, ours included, fill in older publish dates from YouTube's rounded "3 weeks ago" labels, so the hour attached to them is noise. When I ran the first pass on a year of our full catalogue, the busiest upload hour came out as 2am UTC. That is not when creators post. It is when the crawler happened to read the page.
So I threw that set away and used only uploads TubeAI tracked live from the minute they appeared, where the publish time is exact to the second. That gave me 209,096 long-form videos (3 minutes or longer) from 26,268 creator channels, published between August 31 and September 24, 2026.
For each video I took its views 7 days after publishing, read from hourly view history, and divided them by the median 7-day views of the same channel's other uploads in the window. Every channel needed at least 4 uploads to count. This matters: a big channel that always posts at 3pm would otherwise make 3pm look strong. Comparing each video with its own channel removes channel size from the picture. A "breakout" below is an upload that reached at least twice its channel's median.
All times are UTC. In September, 14:00 UTC was 10am in New York, 7am in Los Angeles and 3pm in London.
Every hour of the day performs about the same
Across all 209,096 uploads, 13.2% broke out and 12.0% landed under half their channel's median. Split by publish hour, the breakout share moves by less than two and a half points from top to bottom. The chart below starts at zero so the scale is honest: the bars are almost flat.
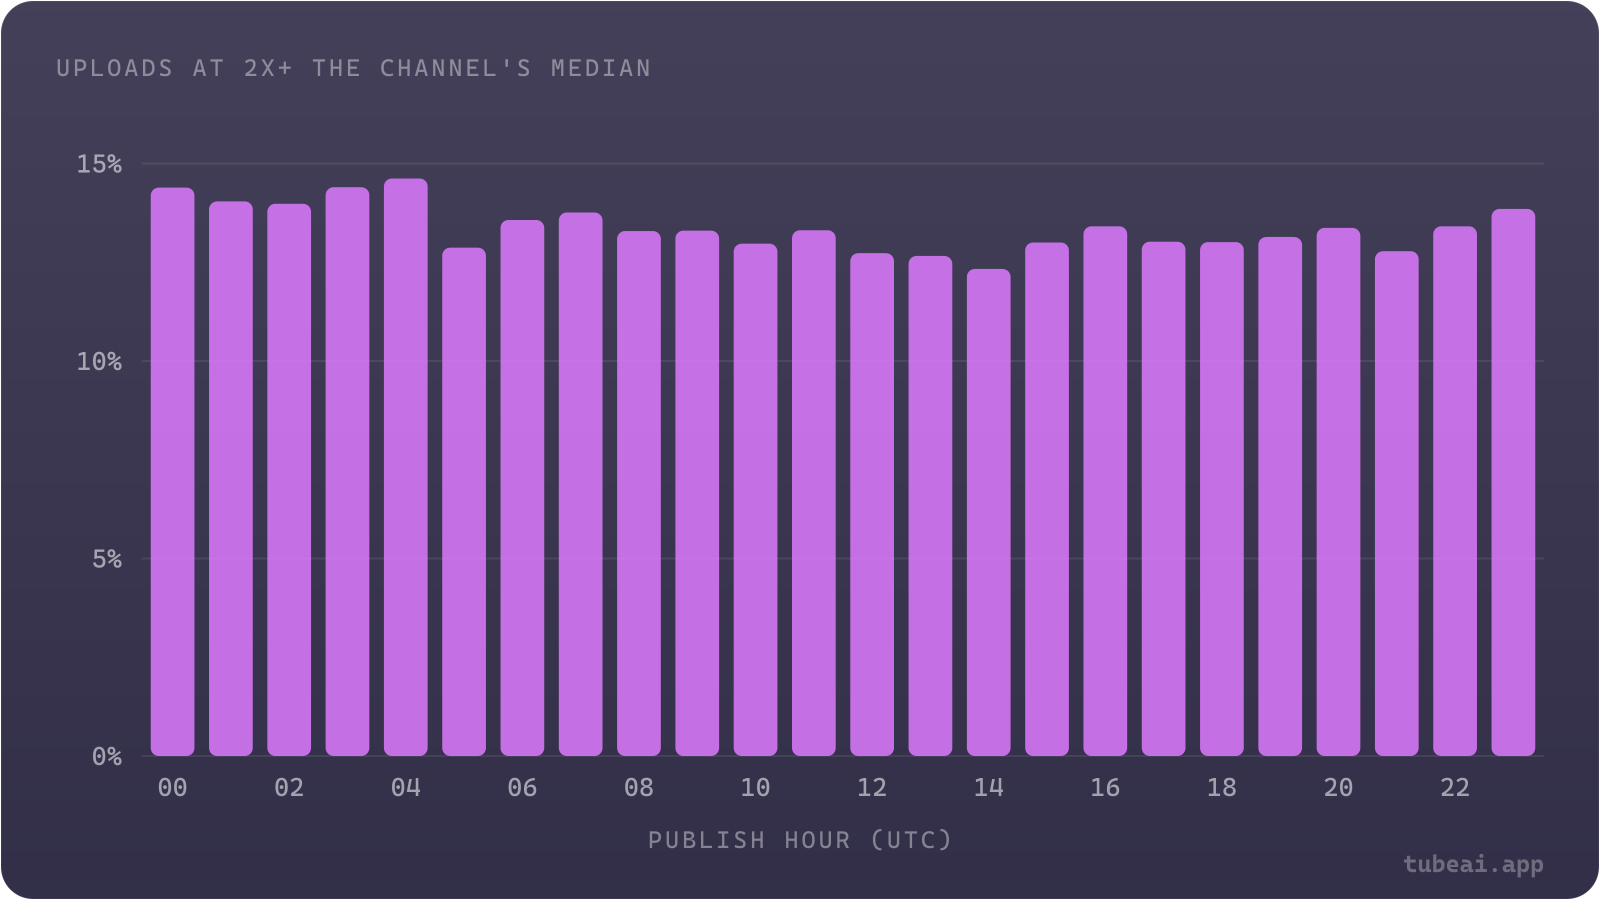
Chart data
| Publish hour (UTC) | Uploads at 2x+ the channel's median (%) |
|---|---|
| 00 | 14.39 |
| 01 | 14.04 |
| 02 | 13.98 |
| 03 | 14.4 |
| 04 | 14.62 |
| 05 | 12.87 |
| 06 | 13.57 |
| 07 | 13.76 |
| 08 | 13.29 |
| 09 | 13.3 |
| 10 | 12.97 |
| 11 | 13.31 |
| 12 | 12.73 |
| 13 | 12.66 |
| 14 | 12.33 |
| 15 | 13 |
| 16 | 13.41 |
| 17 | 13.02 |
| 18 | 13.01 |
| 19 | 13.14 |
| 20 | 13.37 |
| 21 | 12.78 |
| 22 | 13.41 |
| 23 | 13.85 |
The small pattern that does exist runs the opposite way to most advice. The strongest stretch is 00:00-04:00 UTC, which is evening in the Americas and the middle of the night in Europe. The weakest stretch is 12:00-15:00 UTC, the morning in the US and the afternoon in Europe, which is exactly when most posting-time guides tell you to upload.
Why the quiet hours edge ahead
The most likely reason is competition. Uploads are not spread evenly across the day: they bunch up in the US morning and early afternoon. The busiest hour, 16:00 UTC, saw 16,122 uploads in this sample. The quietest, 06:00 UTC, saw 2,860.
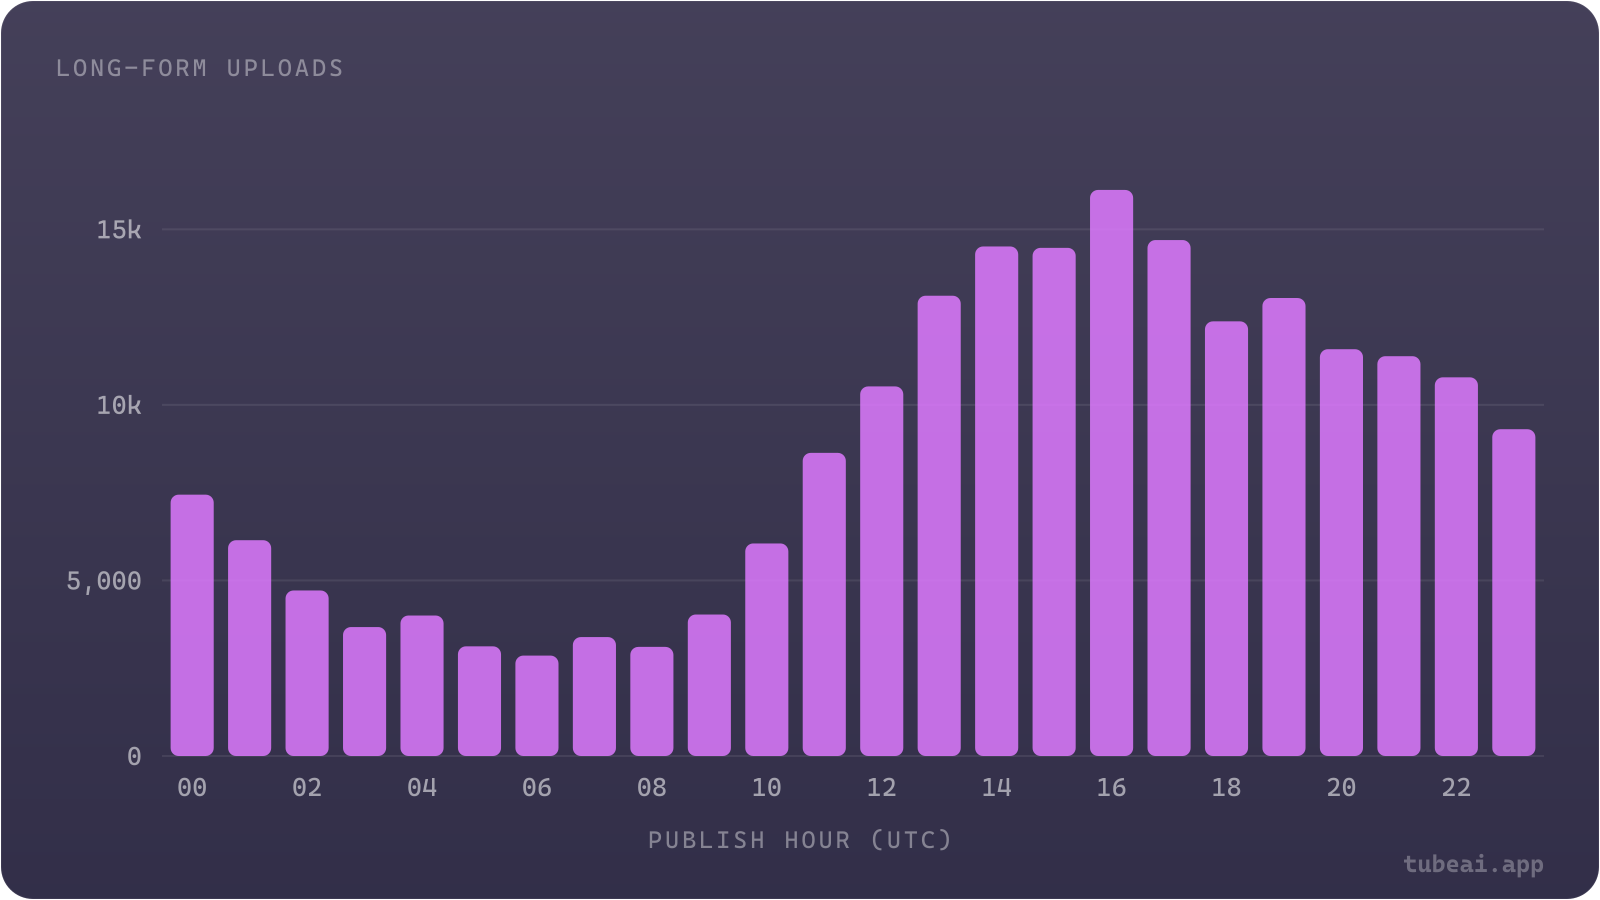
Chart data
| Publish hour (UTC) | Long-form uploads |
|---|---|
| 00 | 7,443 |
| 01 | 6,146 |
| 02 | 4,714 |
| 03 | 3,673 |
| 04 | 4,001 |
| 05 | 3,123 |
| 06 | 2,860 |
| 07 | 3,387 |
| 08 | 3,107 |
| 09 | 4,030 |
| 10 | 6,054 |
| 11 | 8,633 |
| 12 | 10,526 |
| 13 | 13,109 |
| 14 | 14,512 |
| 15 | 14,473 |
| 16 | 16,122 |
| 17 | 14,695 |
| 18 | 12,379 |
| 19 | 13,044 |
| 20 | 11,586 |
| 21 | 11,387 |
| 22 | 10,785 |
| 23 | 9,307 |
A video posted into a quieter hour reaches subscribers' home feeds with fewer new uploads competing beside it. Even so, the reward is small. The 3-hour blocks tell the same story as the single hours:
| Block (UTC) | Uploads | Broke out (2x+) | Flopped (under 0.5x) |
|---|---|---|---|
| 00:00-03:00 | 18,303 | 14.2% | 11.7% |
| 03:00-06:00 | 10,797 | 14.0% | 12.2% |
| 06:00-09:00 | 9,354 | 13.6% | 12.2% |
| 09:00-12:00 | 18,717 | 13.2% | 11.8% |
| 12:00-15:00 | 38,147 | 12.6% | 12.1% |
| 15:00-18:00 | 45,290 | 13.2% | 12.0% |
| 18:00-21:00 | 37,009 | 13.2% | 12.1% |
| 21:00-24:00 | 31,479 | 13.3% | 11.8% |
The best day to post on YouTube
Days show the same pattern as hours. Saturday is the strongest day at 14.4%, Wednesday the weakest at 12.7%, and the other five days sit between 12.9% and 13.5%. Saturday is also one of the two quietest days for uploads (23,938 in the sample, against 35,848 on Wednesday). Fewer uploads competing again lines up with slightly better odds.
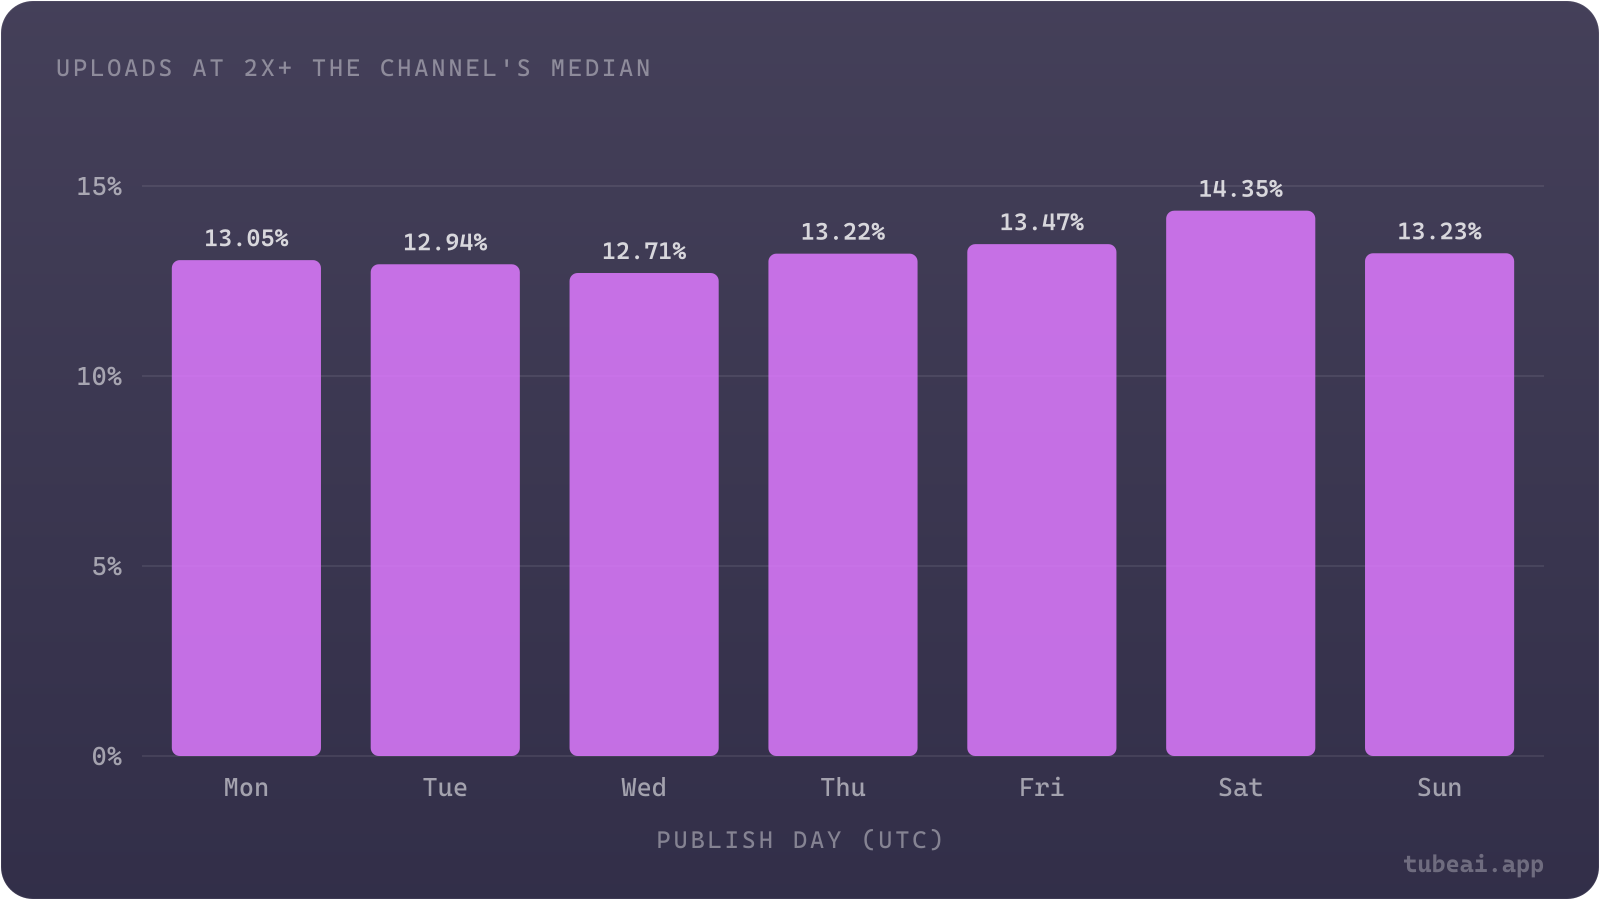
Chart data
| Publish day (UTC) | Uploads at 2x+ the channel's median (%) |
|---|---|
| Mon | 13.05 |
| Tue | 12.94 |
| Wed | 12.71 |
| Thu | 13.22 |
| Fri | 13.47 |
| Sat | 14.35 |
| Sun | 13.23 |
Posting at your usual time keeps results steady
The one timing choice that clearly changes something is consistency. For every channel I found the hour it posted at most often in the window, then measured how far each upload landed from that hour.
| Published | Uploads | Broke out (2x+) | Flopped (under 0.5x) | Typical result vs median |
|---|---|---|---|---|
| At the usual hour | 110,712 | 12.1% | 10.7% | 1.02x |
| 1-2 hours off | 41,282 | 13.5% | 12.3% | 1.02x |
| 3-6 hours off | 33,901 | 14.8% | 13.9% | 1.02x |
| 7+ hours off | 23,201 | 15.8% | 14.7% | 1.03x |
Moving away from your usual slot does not make the typical video better or worse: it sits at about 1.02x the channel's median in every row. What changes is the spread. Uploads 7 or more hours off schedule broke out 15.8% of the time, but they also flopped 14.7% of the time. At the usual hour those figures were 12.1% and 10.7%.
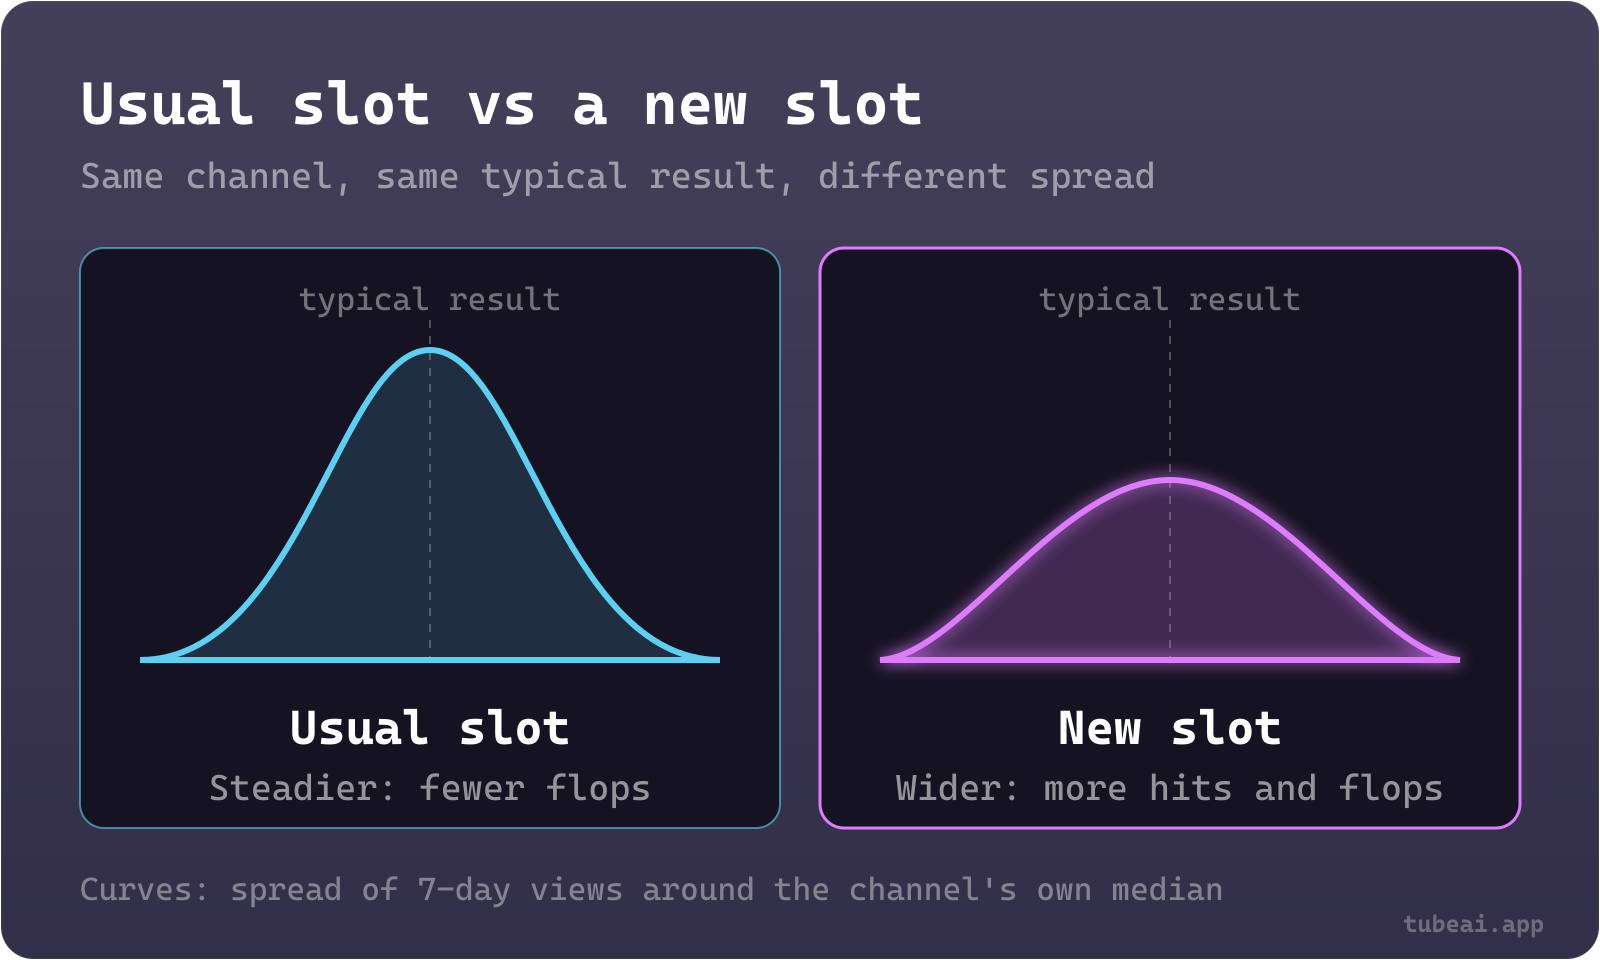
Part of that spread is probably the content, not the clock: creators often post special videos, collaborations or reactions to news outside their routine. Either way, the usual slot is the steadier bet and a new slot is the riskier one, and neither raises the typical result.
Timing works differently by niche
The all-niche averages hide some real differences. In fast-moving, conversation-driven niches, uploads outside the busy hours did noticeably better. In a few hands-on niches, the pattern reversed.
| Niche | Uploads | 12:00-18:00 UTC | 00:00-09:00 UTC | Mon-Fri | Sat-Sun |
|---|---|---|---|---|---|
| Gaming | 60,023 | 12.5% | 13.8% | 12.8% | 13.3% |
| Commentary & Analysis | 12,006 | 14.9% | 16.5% | 14.8% | 15.9% |
| Reaction Videos | 11,067 | 17.4% | 20.2% | 17.9% | 20.0% |
| Travel & Adventure | 6,903 | 13.4% | 14.3% | 13.1% | 15.7% |
| Politics & Government | 5,830 | 15.4% | 17.0% | 15.7% | 16.9% |
| Financial Markets | 4,455 | 9.9% | 9.0% | 9.2% | 10.2% |
| Food | 3,882 | 13.3% | 11.8% | 11.9% | 13.9% |
| Crafts & Handmade | 3,799 | 10.9% | 7.4% | 9.4% | 11.2% |
| Relationships & Family | 3,090 | 13.7% | 13.7% | 13.6% | 10.8% |
Reaction Videos gained the most from the quiet hours (20.2% vs 17.4%), and Travel gained the most from weekends (15.7% vs 13.1%). Crafts & Handmade went the other way: uploads in the quiet hours broke out only 7.4% of the time, against 10.9% in the afternoon. Relationships & Family did worse on weekends. These splits rest on fewer uploads than the headline numbers, so treat them as a starting point for your own test, not a rule.
How to pick your posting time
Start where your viewers are awake
Check when your audience is on YouTube in YouTube Studio and pick a slot inside that window. Any reasonable hour works; the data shows no magic one.
Convert the time properly
If you borrow a UTC hour from this post, convert it to your time zone and check the day too. Late UTC Friday is Friday evening in the Americas.
Stay on it
Post at the same slot for at least four uploads in a row. A consistent slot gave the fewest flops in this data.
Test one change at a time
To try a quieter slot, move only the time, not the format or the topic. Otherwise you cannot tell what caused the result.
Judge by 7-day views vs your median
Compare each video with your own channel, not with other creators. A difference of a point or two is noise, not a reason to rebuild your schedule.
What actually moves your views
If timing is worth a point or two, the bigger levers are elsewhere: how often you publish, how long the video is, and how you package it. I covered those with the same database in how often you should upload, how long a YouTube video should be and how long a YouTube title should be. Spend your planning time there first, and choose a posting slot you can stick to.
Frequently asked questions
What is the best time to post on YouTube?
There is no time that changes much. Across 209,096 uploads, the best hour (04:00 UTC) produced a breakout 14.6% of the time and the worst (14:00 UTC) 12.3%. The quiet hours, evening in the Americas, do slightly better than the busy US morning. Pick a slot when your viewers are awake and keep it.
What is the best day to post on YouTube?
Saturday, by a small margin: 14.4% of Saturday uploads broke out, against 12.7% on Wednesday, the weakest day. The other days sit near 13%. The difference is too small to justify moving a schedule that already works.
Does posting at the same time every week matter?
It makes results steadier. Uploads at a channel's usual hour flopped 10.7% of the time; uploads 7 or more hours off schedule flopped 14.7% of the time and broke out more often too. The typical result was the same either way.
Should I post when my audience is online or when fewer creators post?
Start with when your audience is online, which YouTube Studio shows you. Within that window, a slightly less crowded hour may help a little, but test it over several uploads and compare 7-day views with your own median.
What time zone are these results in?
All hours and days in this study are UTC. In September 2026, 14:00 UTC was 10am in New York, 7am in Los Angeles and 3pm in London. Convert both the hour and the day before you apply them.