
What percentage of subscribers watch your YouTube videos? What 4.9 million videos show
I compared the views of 4.9 million long-form videos with each channel's subscriber count. The typical video gets views equal to about 1 in 10 subscribers on smaller channels and 1 in 25 on channels with a million or more.

A typical long-form YouTube video gets views equal to about 11% of the channel's subscribers at 5k-10k subscribers, 9% at 10k-100k, 5.8% at 100k-1M and 3.9% at 1M and above. I measured this on 4,907,763 videos published between January and June 2026 by 152,252 creator channels in the TubeAI database. The share falls steadily as channels grow, and the niche you are in moves it even more than your size.
One thing to keep straight before the numbers: a view count includes people who never subscribed. So these figures are views as a share of subscribers, not the share of subscribers who watched. They are still the most useful benchmark a creator can check, because both numbers are public on every channel.
- 11%5k-10k subscribers831,842 videos
- 9.0%10k-100k subscribers2,527,157 videos
- 5.8%100k-1M subscribers1,301,064 videos
- 3.9%1M+ subscribers247,700 videos
The bigger the channel, the smaller the share
Splitting channels into finer size bands shows the same thing at every step: each band's typical video reaches a slightly smaller share of its subscriber count than the band below it. Channels with 5k-10k subscribers sit at 11%, channels with 50k-100k at 8.1%, channels with 500k-1M at 5.1%, and channels with more than 5 million at 2.7%.
That doesn't mean big channels get fewer views. A 2 million subscriber channel at 4% still gets around 80,000 views per video. It means the subscriber count overstates the audience that turns up for each upload more and more as a channel grows. The data shows the pattern, not its cause. One likely factor is that a subscriber count only goes up, so a large, older channel carries more people who subscribed years ago and no longer watch.
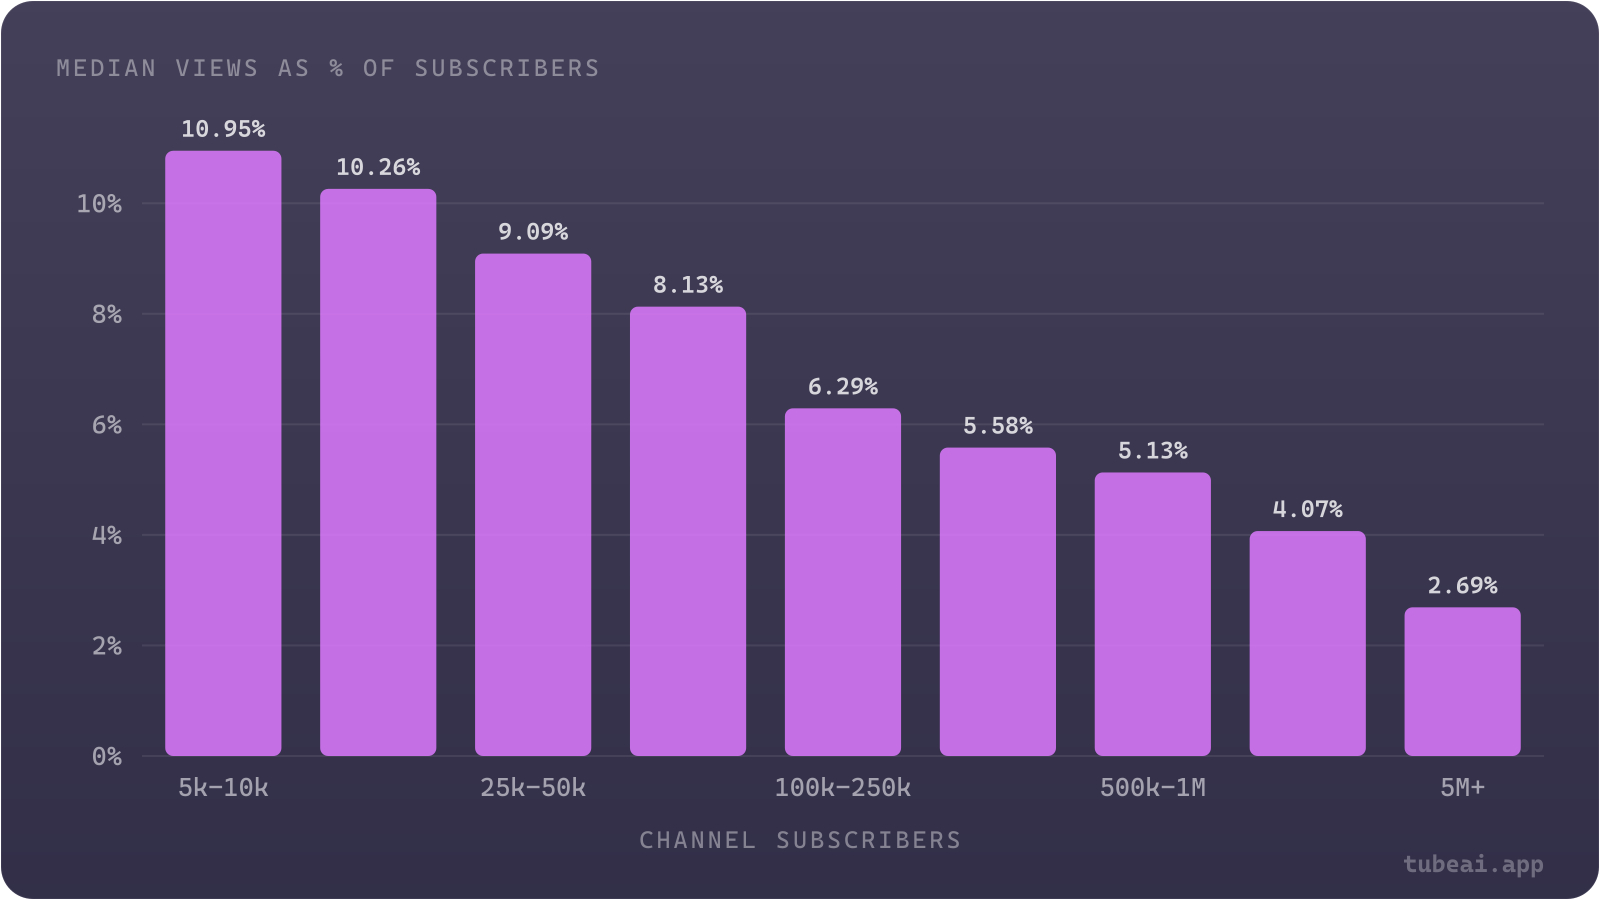
Chart data
| Channel subscribers | Median views as % of subscribers (%) |
|---|---|
| 5k-10k | 10.95 |
| 10k-25k | 10.26 |
| 25k-50k | 9.09 |
| 50k-100k | 8.13 |
| 100k-250k | 6.29 |
| 250k-500k | 5.58 |
| 500k-1M | 5.13 |
| 1M-5M | 4.07 |
| 5M+ | 2.69 |
Typical video vs typical channel
The figures above give every video one vote, so channels that upload a lot weigh more. If I instead take each channel's own median video and then look at the middle channel, the numbers come out a little higher: 14.7% at 5k-10k down to 5.3% at 1M+. The spread between channels is wide. At 10k-100k, the middle half of channels runs anywhere from 3.9% to 33.6%, so a channel at 5% is not broken and a channel at 30% is not unusual.
| Channel size | Videos | Typical video | Typical channel | Middle half of channels | Videos beating sub count |
|---|---|---|---|---|---|
| 5k-10k | 831,842 | 11.0% | 14.7% | 4.5% to 40.4% | 8.7% |
| 10k-100k | 2,527,157 | 9.0% | 12.4% | 3.9% to 33.6% | 6.7% |
| 100k-1M | 1,301,064 | 5.8% | 7.8% | 2.4% to 22.5% | 3.2% |
| 1M+ | 247,700 | 3.9% | 5.3% | 1.6% to 14.3% | 1.1% |
How often a video gets more views than you have subscribers
Out-viewing your own subscriber count is a real milestone, and it gets rarer with size. It happens on 8.7% of videos from 5k-10k channels, 6.7% at 10k-100k, 3.2% at 100k-1M and 1.1% at 1M+. Small channels hit it more often because their subscriber count is a lower bar: a video that reaches a few thousand non-subscribers through search or recommendations is enough.
The other end moves the opposite way. The share of videos that get views below 1% of subscribers rises from 12.8% at 10k-100k to 15.8% at 100k-1M and 23.0% at 1M+. If one of those is yours, it is common at every size. If most of your recent uploads sit there, the reasons are covered in why YouTube views drop.
Your niche changes the number more than your size
To compare niches fairly I held size fixed and only used channels with 10k-100k subscribers. Across the 54 niches with at least 300 such channels, the typical video ranges from 21.4% of subscribers in ASMR to 3.1% in Education & Learning. That is a wider gap than the one between a 10k channel and a 1M channel.
The high end is mostly hobby and repeat-viewing content: ASMR, Boats & Marine, Homesteading, Fishing, Trading Cards. The low end includes Education, Business, Software Development and Personal Development, where people often subscribe after one useful video and don't come back for every upload. Gaming, the biggest niche with 16,423 channels in this band, sits close to the middle at 11.0%. For niches where small channels still get views, see low-competition YouTube niches.
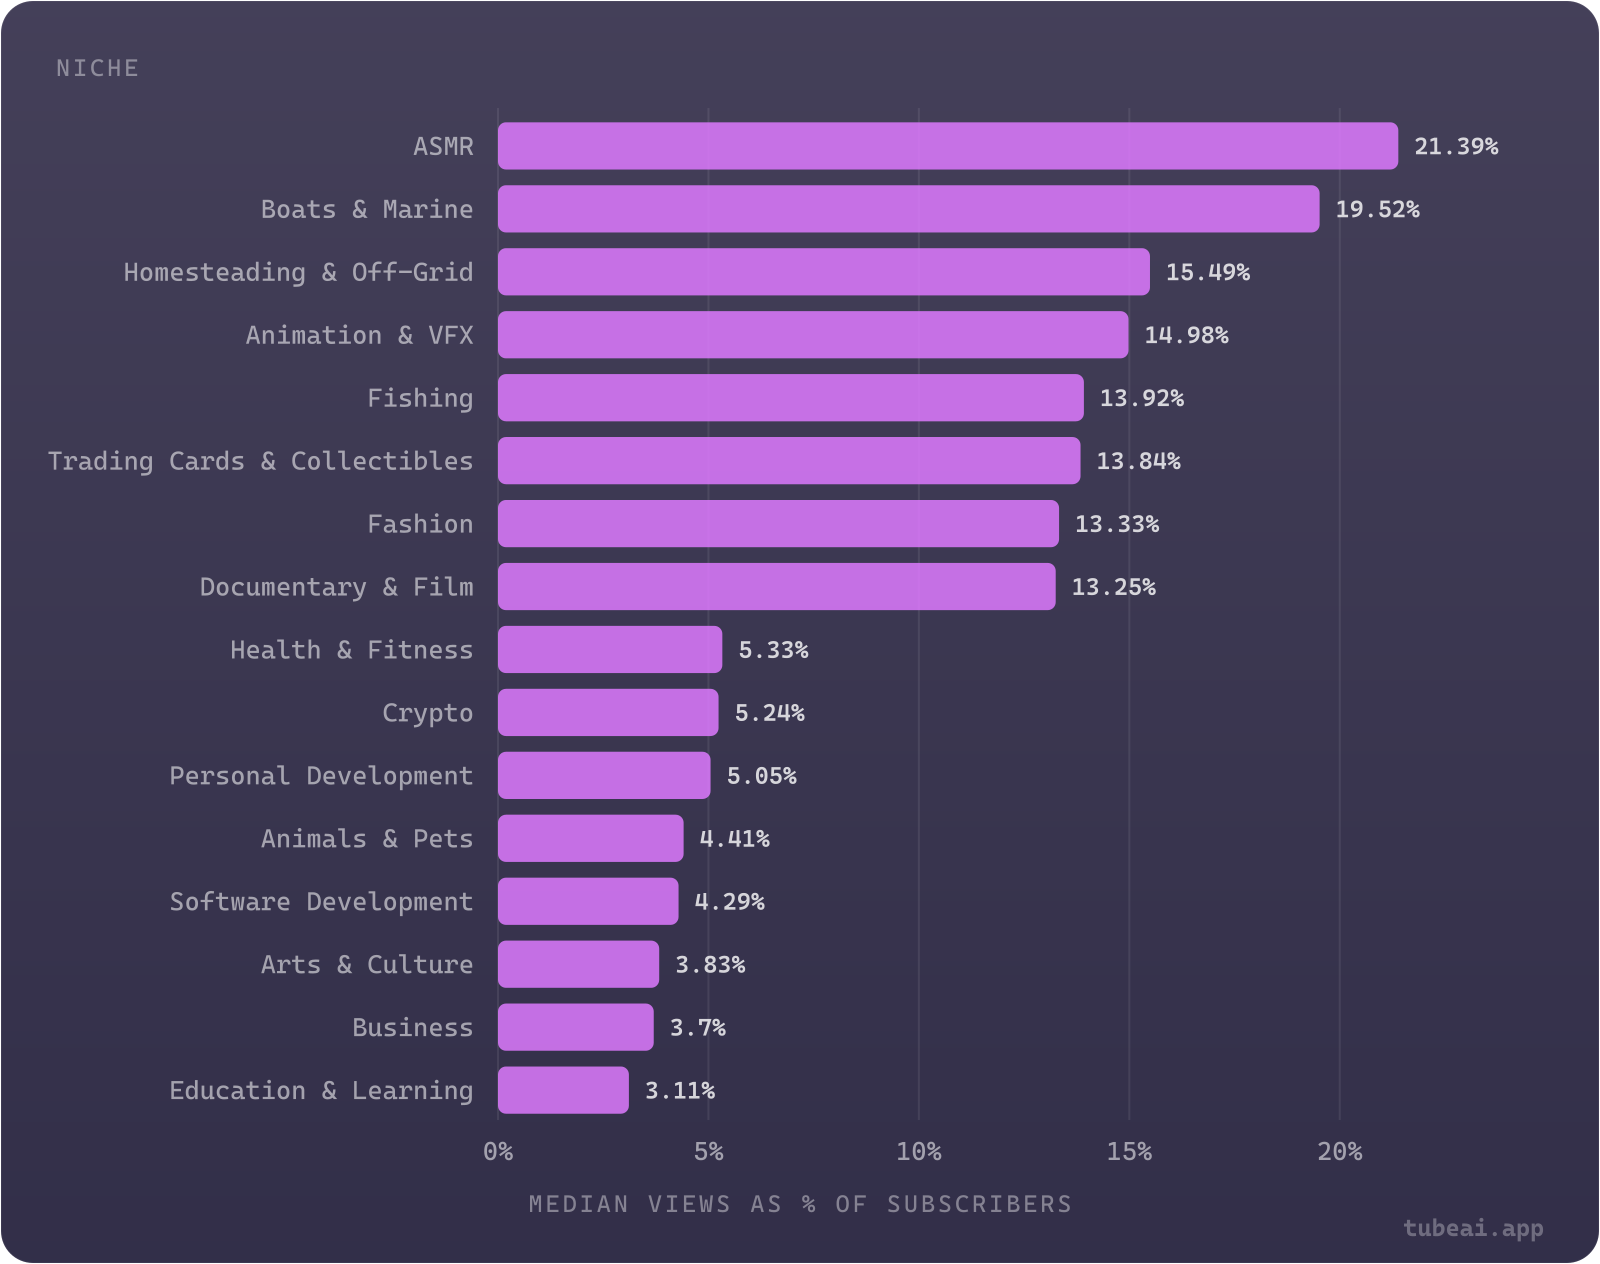
Chart data
| Niche | Median views as % of subscribers (%) |
|---|---|
| ASMR | 21.39 |
| Boats & Marine | 19.52 |
| Homesteading & Off-Grid | 15.49 |
| Animation & VFX | 14.98 |
| Fishing | 13.92 |
| Trading Cards & Collectibles | 13.84 |
| Fashion | 13.33 |
| Documentary & Film | 13.25 |
| Health & Fitness | 5.33 |
| Crypto | 5.24 |
| Personal Development | 5.05 |
| Animals & Pets | 4.41 |
| Software Development | 4.29 |
| Arts & Culture | 3.83 |
| Business | 3.7 |
| Education & Learning | 3.11 |
What to do with this
- Stop reading subscribers as your audience. Plan around views per video. On a 50k channel, expect around 4,000 views for a typical upload, not 50,000.
- Judge a video against your own median, not your sub count. A video at 2x your usual views is a hit even if it sits far below your subscriber number. What one hit does to a channel afterwards is covered in does a viral video grow your channel.
- Expect the share to shrink as you grow. Falling from 11% to 8% between 10k and 100k subscribers is the normal path, not a decline.
- Keep a steady rhythm. Upload pace changes how much of your audience you keep reaching; the numbers are in how often to upload.
How I measured this
I took every long-form video (over 3 minutes) published between January 1 and June 30, 2026 by served creator channels with at least 5,000 subscribers, and divided each video's views by its channel's subscriber count. Both numbers are as of October 26, 2026, so every video had at least four months to collect views. Shorts are excluded. Channels under 5,000 subscribers are left out because the database tracks too few of them to give a fair picture.
To check that video age doesn't skew the result, I ran the same measure month by month for 10k-100k channels. Videos published each month from July 2025 to June 2026 landed between 8.7% and 10.1%, so six months is a settled window. Videos published from August 2026 onward came out higher (11.5% and 17.2%) for reasons I couldn't confirm, so I left them out.
Frequently asked questions
What is a good view-to-subscriber ratio on YouTube?
For long-form videos, the typical channel under 100k subscribers gets views equal to about 9-11% of its subscribers per video, channels with 100k-1M about 6%, and channels with 1M+ about 4%. Above those figures puts you in the better half of channels your size. Your niche can shift the benchmark a lot, from about 3% in Education to over 20% in ASMR.
Does this mean only 10% of my subscribers watch my videos?
No. A view count includes people who are not subscribed, so the share of subscribers who actually watched is lower than these figures. YouTube does not make the subscriber-only share public, so views as a percentage of subscribers is the benchmark you can compare across channels.
Is it normal to get more views than subscribers?
It happens, but not often. 8.7% of videos from 5k-10k channels got more views than the channel had subscribers, falling to 1.1% for channels with a million or more.
Why do bigger channels get a smaller share of their subscribers in views?
The data shows the share falls at every step up in size, from 11% at 5k-10k to 2.7% at 5M+. It doesn't show the cause. A likely factor is that subscriber counts only grow, so older, larger channels carry more subscribers who stopped watching.
Are Shorts included?
No. This analysis only covers long-form videos over 3 minutes. Shorts views behave differently and would need their own benchmark.