
Why are my YouTube views dropping? What 116,704 channels show
In just two weeks, 30.6% of channels saw their daily views fall by a fifth or more while YouTube as a whole grew. Here is what the channels that dropped had in common.

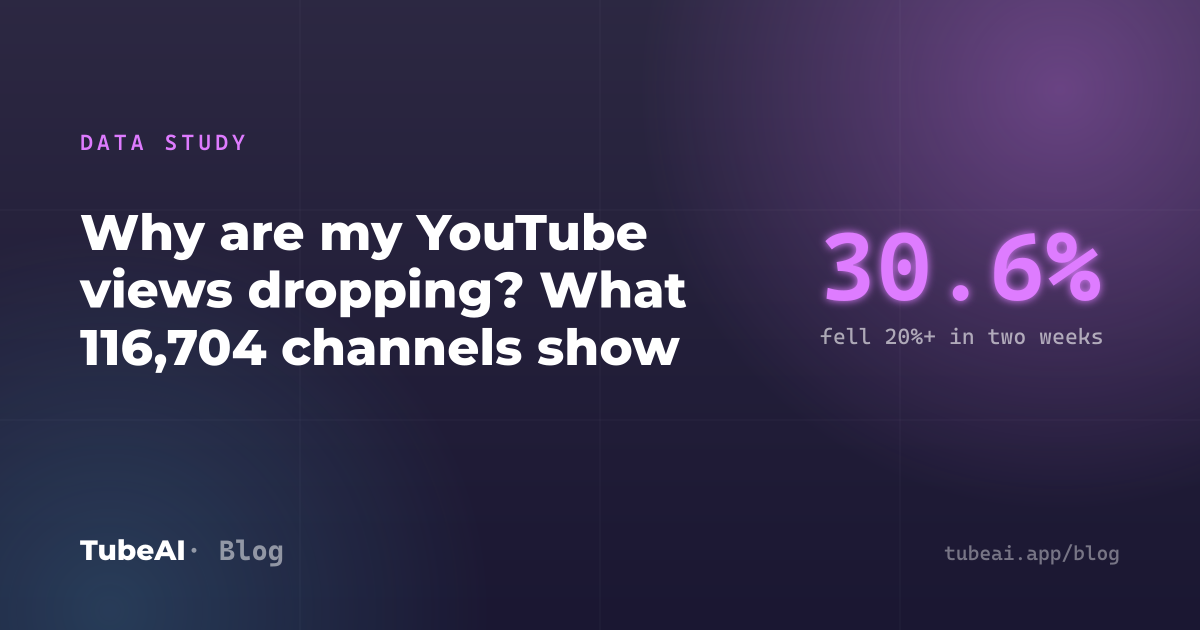
Most YouTube views drops come from the channel, not from YouTube. In the TubeAI research database, 30.6% of 116,704 creator channels saw their daily views fall by 20% or more from one two-week period to the next (late September to early October 2026), while the total views of those same channels went up 10.7%. The channels that dropped most often were the ones that stopped uploading (47.2% fell 20%+), small channels under 10K subscribers (45.1%), and channels coming off a big hit (38.8% after a 10x+ upload). No niche fell as a whole: in every niche, most channels held steady or grew.
Below: how common a drop is, the four things that go with one, and a checklist to work out which one is yours.
- 30.6%of channels lost 20%+ of daily views9.8% lost half or more
- 21.9%gained 25%+ in the same weeks7.4% doubled
- -5.3%change for the median channelsmall swings are normal
- +10.7%change in total views, all channelsno platform-wide slump
How I measured it
TubeAI records each channel's lifetime view total every day. For every creator channel we serve, I took three readings (Sep 12-14, Sep 26-28 and Oct 9-11, 2026) and worked out the channel's average views per day in the two periods between them, about two weeks each. Then I compared the second period with the first. I kept channels gaining at least 100 views a day, so tiny channels whose numbers jump around on a handful of views did not distort the results: 116,704 channels in all.
This measures a channel's total daily views, from new and old videos alike, which is the number most creators mean when they say their views are dropping. Both periods fall after YouTube's Aug 24 change to how views are counted, so that change does not affect this comparison. (If your views rose in late August and then seemed to settle, that change is the likely reason; see YouTube's new view count.)
How common is a views drop?
Very. Over just two weeks, almost a third of channels lost a fifth of their daily views, and about one in ten lost half. In the same window, more than a fifth of channels grew by 25% or more. The median channel moved down 5.3%, a swing small enough to be ordinary noise.
Meanwhile, the combined daily views of all 116,704 channels rose 10.7%. Views did not disappear from YouTube; they moved between channels. That is the first thing to check before blaming the algorithm: if creators everywhere were losing views at once, the total would have fallen too. It did not.
1. You uploaded less
The clearest pattern in the data is upload pace. I counted each channel's long-form uploads in both periods. Channels that stopped uploading in early October were the most likely to drop: 47.2% fell 20% or more, and one in five saw daily views halve. Channels that kept the same pace dropped 20%+ only 26.3% of the time, and channels that uploaded more only 19.2%.
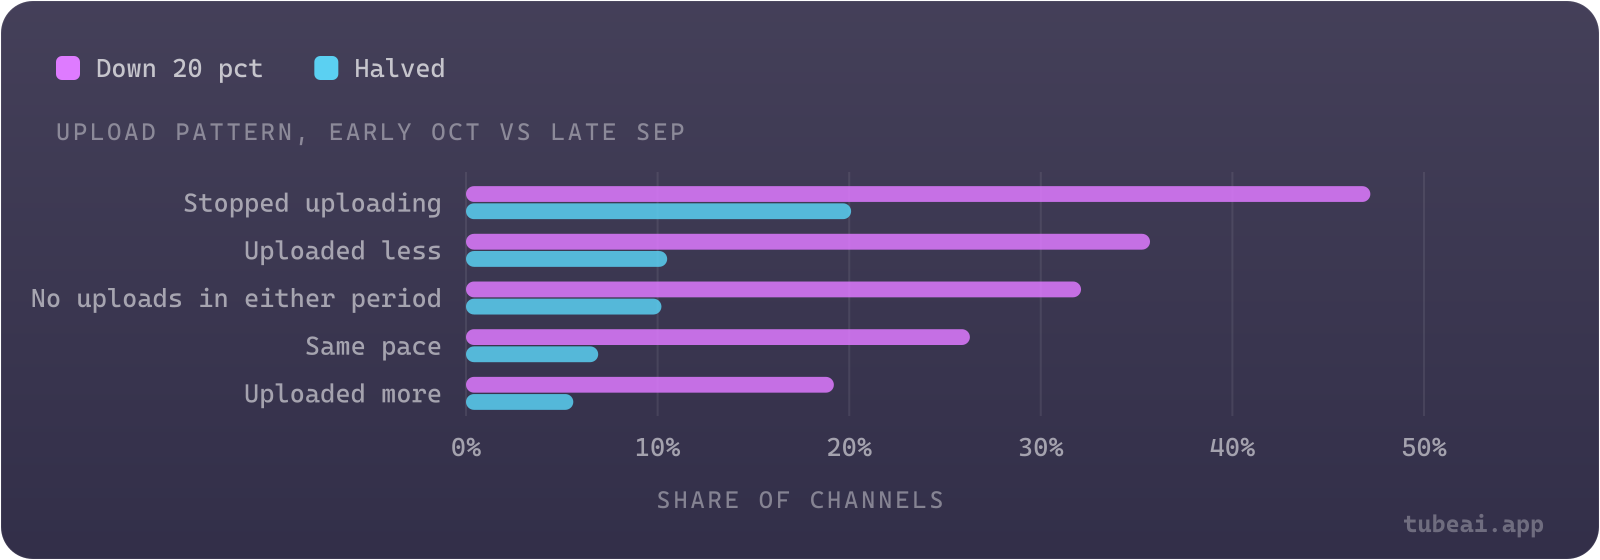
Chart data
| Upload pattern, early Oct vs late Sep | down_20_pct (%) | halved (%) |
|---|---|---|
| Stopped uploading | 47.2 | 20.1 |
| Uploaded less | 35.7 | 10.5 |
| No uploads in either period | 32.1 | 10.2 |
| Same pace | 26.3 | 6.9 |
| Uploaded more | 19.2 | 5.6 |
The reason is mechanical. Every new video brings a burst of views in its first days, and most channels rely on that burst. Stop uploading and the burst stops, while the back catalogue keeps earning roughly what it did. At the median, channels that stopped uploading lost 18.1% of their daily views; channels that uploaded more gained 10.7%. Channels with no long-form uploads in either period (evergreen libraries, or channels that mostly post Shorts) sat in between, with a median drop of 8.0%.
If your views fell after a break, a holiday or a slower schedule, this is the most likely cause, and the fix is simply to get back to your normal pace. For how often to upload in the first place, see how often you should upload to YouTube.
2. A recent hit is fading
A breakout video lifts your whole channel's daily views for a while, then fades. When it does, the channel looks like it is dropping, even though it is only returning to normal. The bigger the late-September hit, the more likely the channel's views fell in early October:
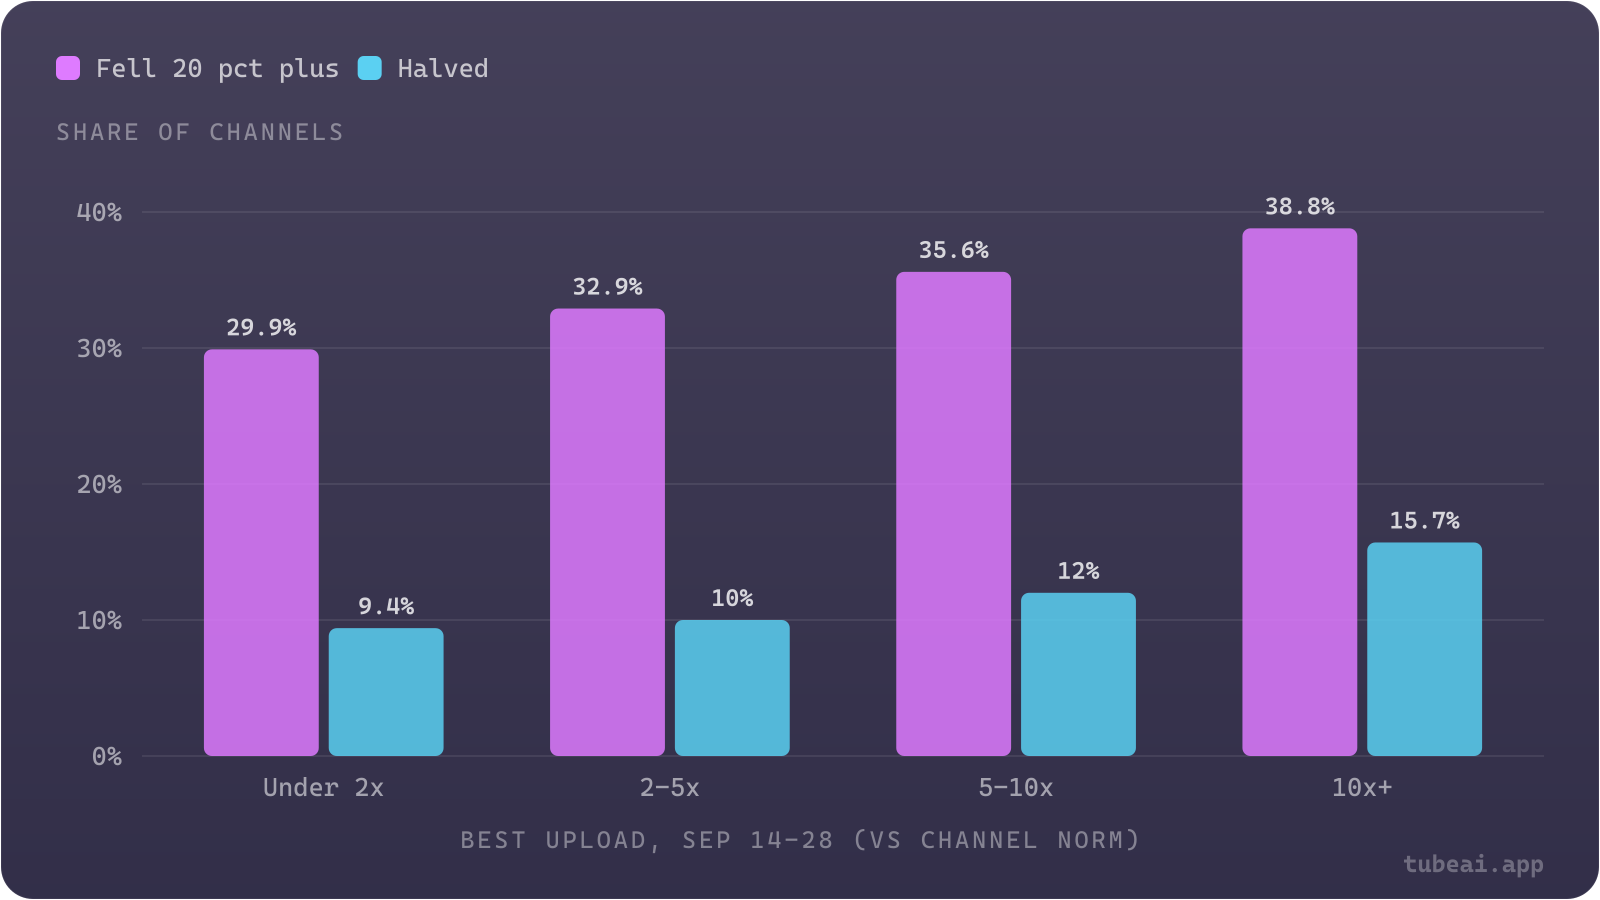
Chart data
| Best upload, Sep 14-28 (vs channel norm) | fell_20_pct_plus (%) | halved (%) |
|---|---|---|
| Under 2x | 29.9 | 9.4 |
| 2-5x | 32.9 | 10 |
| 5-10x | 35.6 | 12 |
| 10x+ | 38.8 | 15.7 |
This is not because those channels gave up: about 85% of channels with a 5x+ hit kept uploading in early October, a higher share than channels without one. Their next videos simply could not match the spike. If your drop started a week or two after your best video in months, compare your current numbers with the weeks before that video, not with its peak. You may not be dropping at all.
3. Your channel is small
Small channels swing much more in both directions. Under 10K subscribers, 45.1% of channels lost 20%+ of their daily views in two weeks and 19.9% lost half. At 1M+ subscribers, only 21.5% lost 20%+ and 4.4% lost half. Big channels also grew more often: 24.8% rose 25% or more, against 17.4% of the smallest.
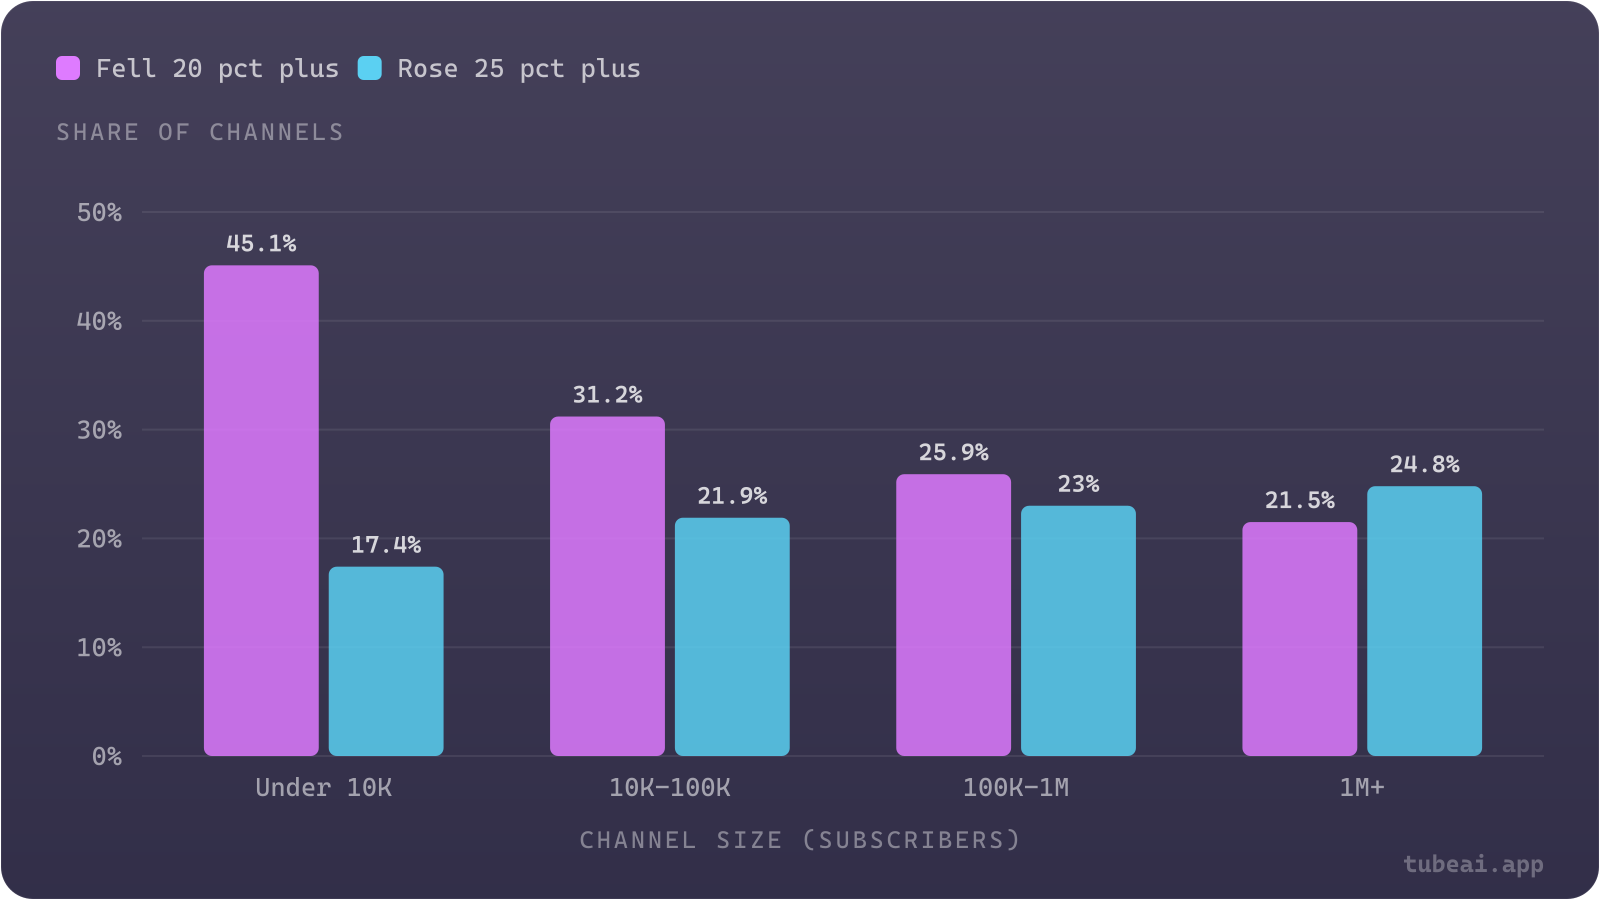
Chart data
| Channel size (subscribers) | fell_20_pct_plus (%) | rose_25_pct_plus (%) |
|---|---|---|
| Under 10K | 45.1 | 17.4 |
| 10K-100K | 31.2 | 21.9 |
| 100K-1M | 25.9 | 23 |
| 1M+ | 21.5 | 24.8 |
A small channel's daily views often rest on one or two videos, so when one of them stops being recommended, the whole channel feels it. A large channel spreads its views across hundreds of videos that rarely all slow down at once. In this period, the combined daily views of channels under 10K fell 23%, while the combined views of 1M+ channels rose 18%. If you are under 10K, a 20% swing over two weeks is close to normal; judge your trend over several months, not a fortnight.
4. Is your whole niche down?
Sometimes it is the topic, not you: a game loses players, a season ends, a news story fades. But in this period no niche fell as a whole. Across 42 niches with at least 800 channels, the median channel's change ranged only from -9.1% (Gaming) to +1.0% (Beauty & Makeup). Even in the weakest niches, most channels did not drop 20%.
| Niche | Channels | Median channel change | Channels down 20%+ | Change in niche total |
|---|---|---|---|---|
| Politics & Government | 1,081 | -9.0% | 39.0% | 0.0% |
| Commentary & Analysis | 3,774 | -8.0% | 37.7% | +1.7% |
| Gaming | 23,904 | -9.1% | 37.0% | -5.0% |
| AI & Machine Learning | 918 | -8.1% | 36.4% | -11.5% |
| Aviation & Flight | 829 | -5.5% | 35.5% | +13.5% |
| Crafts & Handmade | 2,989 | +0.4% | 21.9% | +21.0% |
| Food | 3,285 | +0.9% | 21.8% | +19.1% |
| Product Reviews & Demos | 1,869 | +0.7% | 21.2% | +10.1% |
| Beauty & Makeup | 1,650 | +1.0% | 20.8% | +12.3% |
| Education & Learning | 1,350 | +0.3% | 17.8% | -3.9% |
Drops were more common in Politics, Commentary, Gaming and AI, and rarer in Education, Beauty and Food. Only a few niches lost total views (AI & Machine Learning -11.5%, Gaming -5.0%), and even there most channels held up. To check your own niche, look at a handful of channels your size in it: if they are all down, it is the topic; if they are not, it is your channel.
What to check, in order
Work through these causes in this order, from the most common to the least:
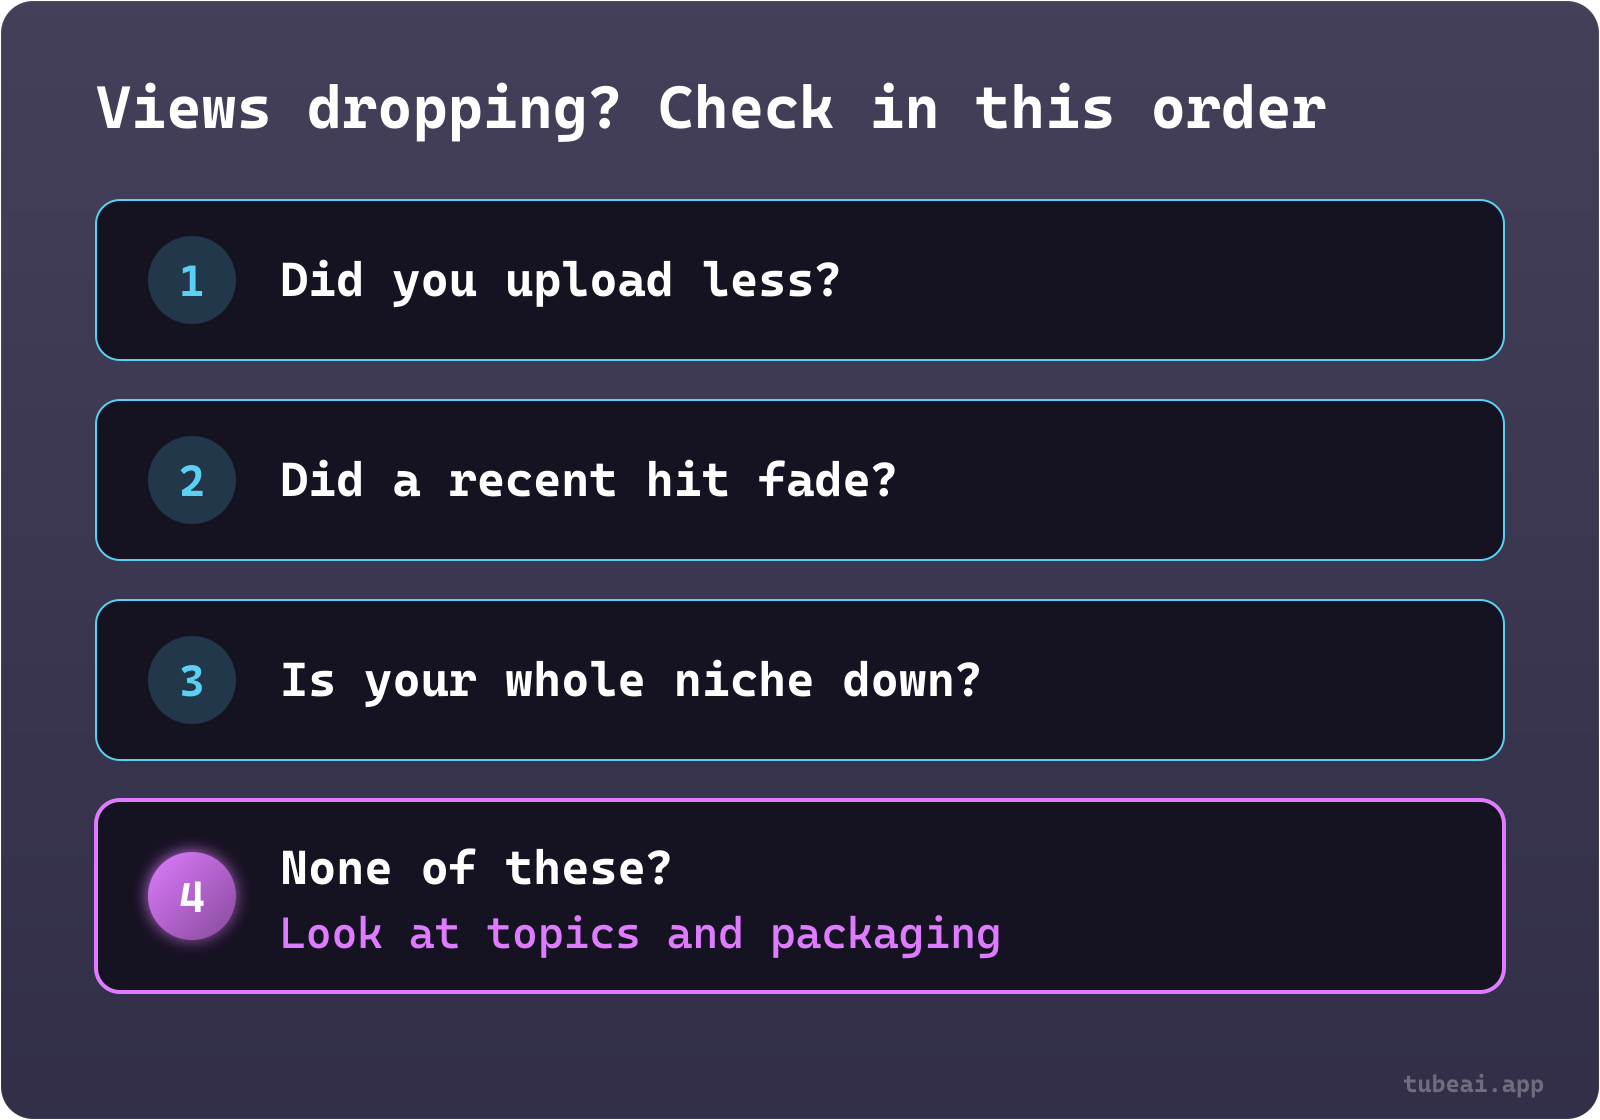
Diagnosing a views drop
Compare your upload count
Count your long-form uploads in the weeks views fell and the weeks before. If you posted less, that alone can explain a 20% drop.
Find your last hit
If a video did several times your usual views shortly before the drop, compare today with the weeks before that video, not with its peak.
Measure over a longer window
Under 10K subscribers, two-week swings of 20% are common. Look at the last three months before deciding something is wrong.
Check channels like yours
Look at a few channels your size in your niche. If they are all down, the topic is cooling. If not, the cause is on your channel.
Then look at topics and packaging
Only after the first four are ruled out: check which recent videos started slower than your usual pace, and test their titles and thumbnails.
For the last step, two other posts help: how long it takes a YouTube video to get views shows what a normal first week looks like, so you can spot a slow starter early, and does changing your thumbnail increase views covers what a packaging swap can and cannot do.
Frequently asked questions
Is it normal for YouTube views to drop?
Yes. In the TubeAI research database, 30.6% of 116,704 creator channels lost 20% or more of their daily views over two weeks in late September to early October 2026, while total views across those channels rose 10.7%.
Is the YouTube algorithm causing my views to drop?
Probably not on its own. Total views across all the channels in our data grew in the same period, and no niche fell as a whole. The most common causes were uploading less, a recent hit fading and normal swings on small channels.
Does not uploading reduce views?
Yes. 47.2% of channels that stopped uploading saw daily views fall 20% or more within two weeks, against 19.2% of channels that uploaded more. At the median, channels that stopped lost 18.1% of their daily views.
Why did my views drop after a viral video?
A breakout lifts your whole channel's views for a while, then fades. 38.8% of channels with a 10x+ upload saw daily views fall 20% or more in the next two weeks, against 29.9% of channels with no upload above 2x. Compare with the weeks before the hit, not its peak.
How long should I wait before worrying about a views drop?
On a channel under 10K subscribers, two-week swings of 20% happen to 45.1% of channels, so judge the trend over a few months. On larger channels a sustained 20% drop is rarer and worth investigating sooner.