
How long does it take a YouTube video to get views? What 321,220 tracked uploads show
I tracked 321,220 uploads hour by hour through their first week. Most views arrive within a day, but the videos that break out follow a slower, longer curve.

Most of a YouTube video's views arrive fast: the median long-form upload gets 54% of its first-week views within 24 hours and 84% within three days. I tracked 321,220 uploads hour by hour from the minute they went live, published Aug 31 to Sep 24, 2026. The exception is the videos that break out. They start slower, reach only 37% of their first-week views by hour 24, and keep climbing for days after a normal video has gone quiet.
So the honest answer to "how long does it take" is: a day for most videos, most of a week for the ones that matter. And the most reliable early signal is not a raw view count. It is how a video's first day compares with your own channel's usual first day.
- 9%by hour 6share of first-week views
- 54%by hour 24all tracked videos
- 84%by day 3all tracked videos
- 37%breakouts by hour 24they climb for longer
How I measured it
Our tracker reads the public view counter of new long-form uploads every hour for their first seven days. I kept only videos we caught within 90 minutes of publishing, so the publish time is exact and the first hour is really the first hour. I dropped videos with fewer than 100 views after a week, because at that size one extra view moves the percentages.
For each video I took its views at day 7 as 100% and measured how much of that total it had reached at each hour. I then grouped videos by how they ended up, using each video's views against its own channel's typical views about a month later: a breakout is 2x or more, a flop is under 0.5x, and everything in between is typical. Comparing each video with its own channel stops big channels from looking fast just because they are big.
The first-week curve
The curve has a clear shape. The first hours are slow: the median video has under 1% of its week by hour 1 and about 4% by hour 3. Part of that is how the counter works, which can lag behind real views in the first hour, but the slow start holds well past it. The real surge runs from roughly hour 6 to hour 24, when a typical video goes from 10% to 57% of its week. After that it is a tail: 74% by hour 48, 85% by hour 72, and the last three days add only a few points.
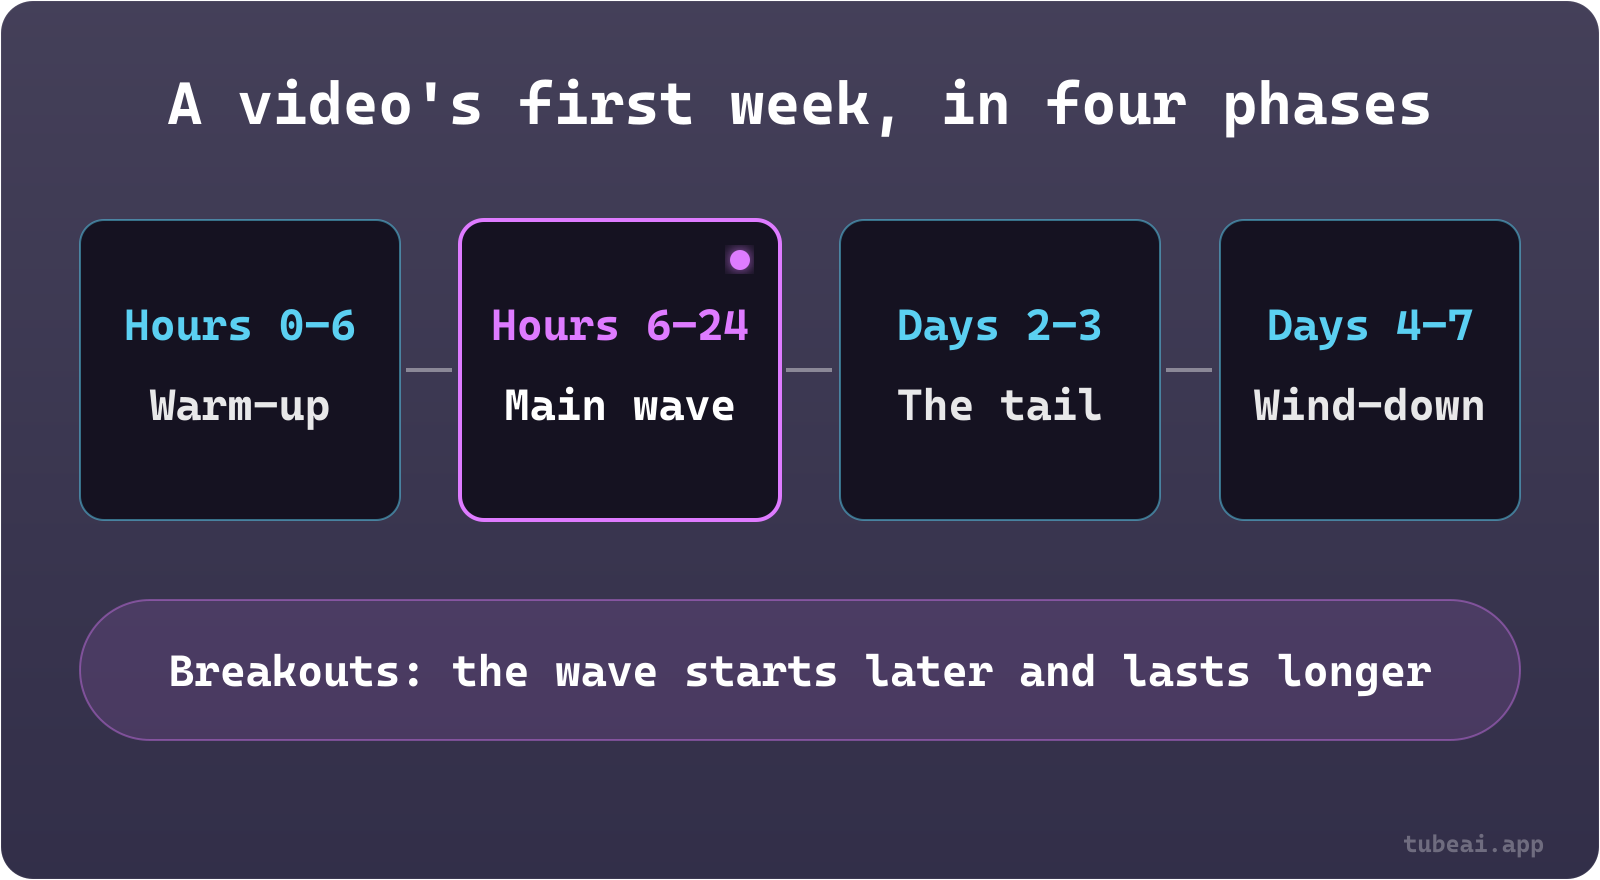
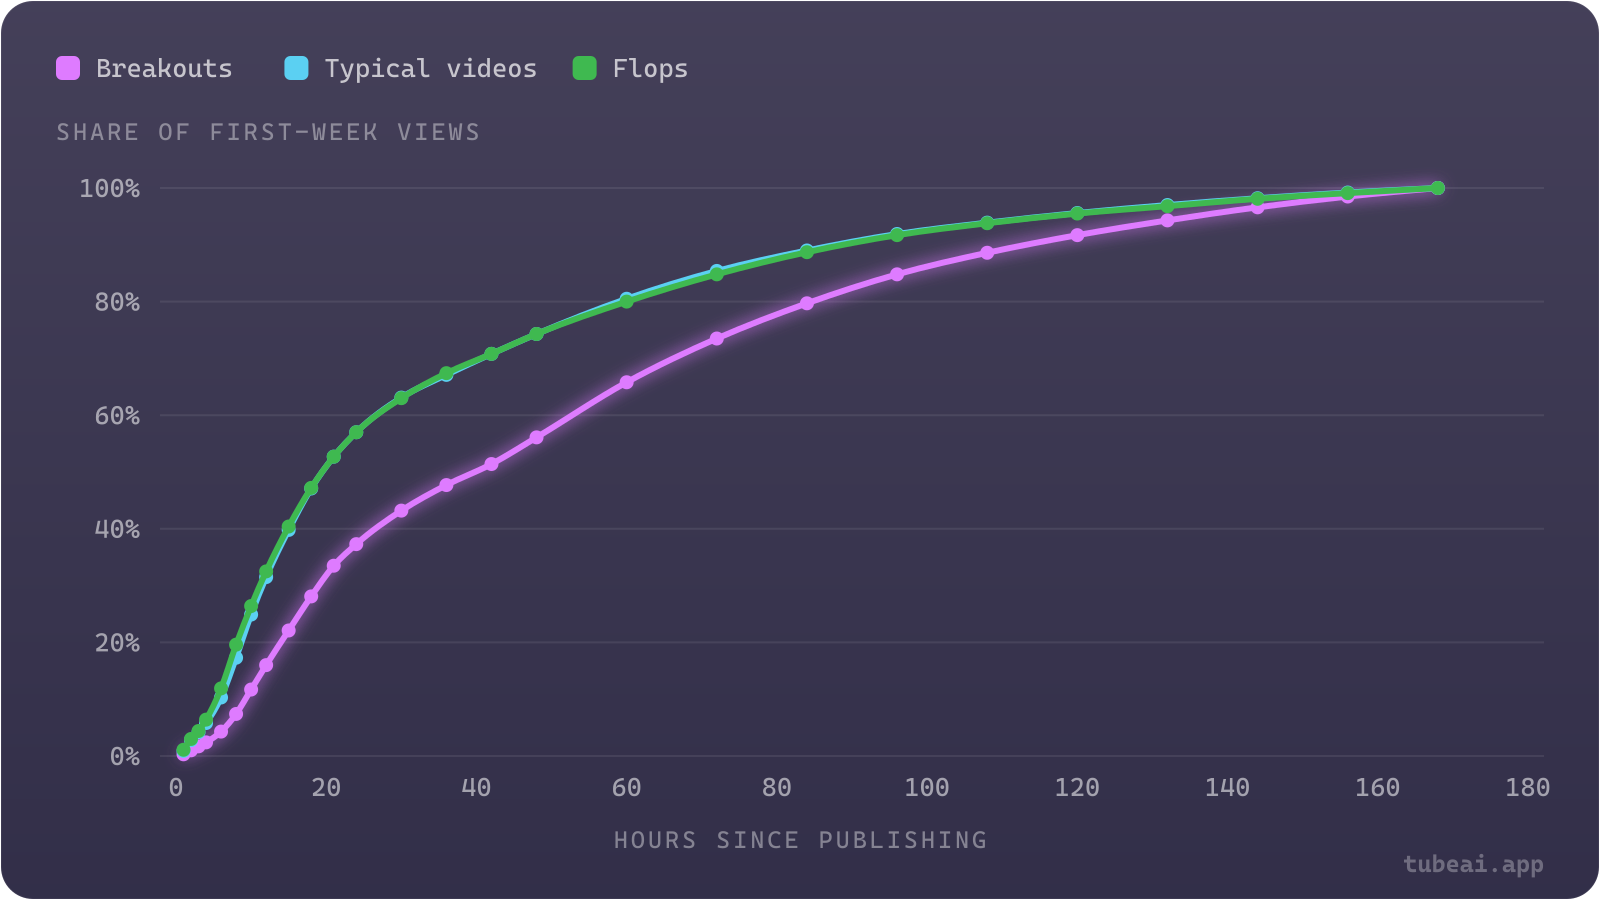
Chart data
| Hours since publishing | breakouts (%) | typical_videos (%) | flops (%) |
|---|---|---|---|
| 1 | 0.3 | 0.9 | 1.1 |
| 2 | 1 | 2.8 | 3 |
| 3 | 1.7 | 4.2 | 4.4 |
| 4 | 2.4 | 5.8 | 6.4 |
| 6 | 4.3 | 10.3 | 11.9 |
| 8 | 7.4 | 17.3 | 19.6 |
| 10 | 11.7 | 24.9 | 26.4 |
| 12 | 16 | 31.5 | 32.5 |
| 15 | 22.1 | 39.8 | 40.4 |
| 18 | 28.1 | 47.1 | 47.2 |
| 21 | 33.5 | 52.7 | 52.7 |
| 24 | 37.3 | 57 | 57 |
| 30 | 43.2 | 63.1 | 63 |
| 36 | 47.7 | 67.1 | 67.4 |
| 42 | 51.4 | 70.8 | 70.8 |
| 48 | 56.1 | 74.3 | 74.3 |
| 60 | 65.8 | 80.5 | 80 |
| 72 | 73.5 | 85.4 | 84.8 |
| 84 | 79.7 | 89 | 88.7 |
| 96 | 84.8 | 91.9 | 91.7 |
| 108 | 88.6 | 93.9 | 93.8 |
| 120 | 91.7 | 95.6 | 95.5 |
| 132 | 94.3 | 97 | 96.8 |
| 144 | 96.6 | 98.2 | 98.1 |
| 156 | 98.5 | 99.2 | 99.1 |
| 168 | 100 | 100 | 100 |
Breakouts keep going after normal videos stop
The striking part of that chart is that typical videos and flops follow almost exactly the same curve. A flop is not a video that dies faster. It is a video that does the same shape at a smaller size. Both reach half of their first week at around hour 20.
Breakouts are different. They reach half of their first week only around hour 40, twice as late, and they are still adding about 15% of their week between day 4 and day 7, when a typical video adds about 8%. That is what a video being picked up by recommendations looks like from the outside: the audience keeps widening after the subscribers who saw it on day one have already watched.
This is the main reason "the first 48 hours decide everything" is only half true. The first 48 hours decide most videos. They do not capture the videos that grow the channel.
What day one does predict
A raw view count at hour 24 tells you little, because every channel has its own normal. The useful number is how a video's first 24 hours compare with your channel's usual first day. I measured that for every channel with at least four tracked uploads in the window, comparing each video with the median first day of its own channel.
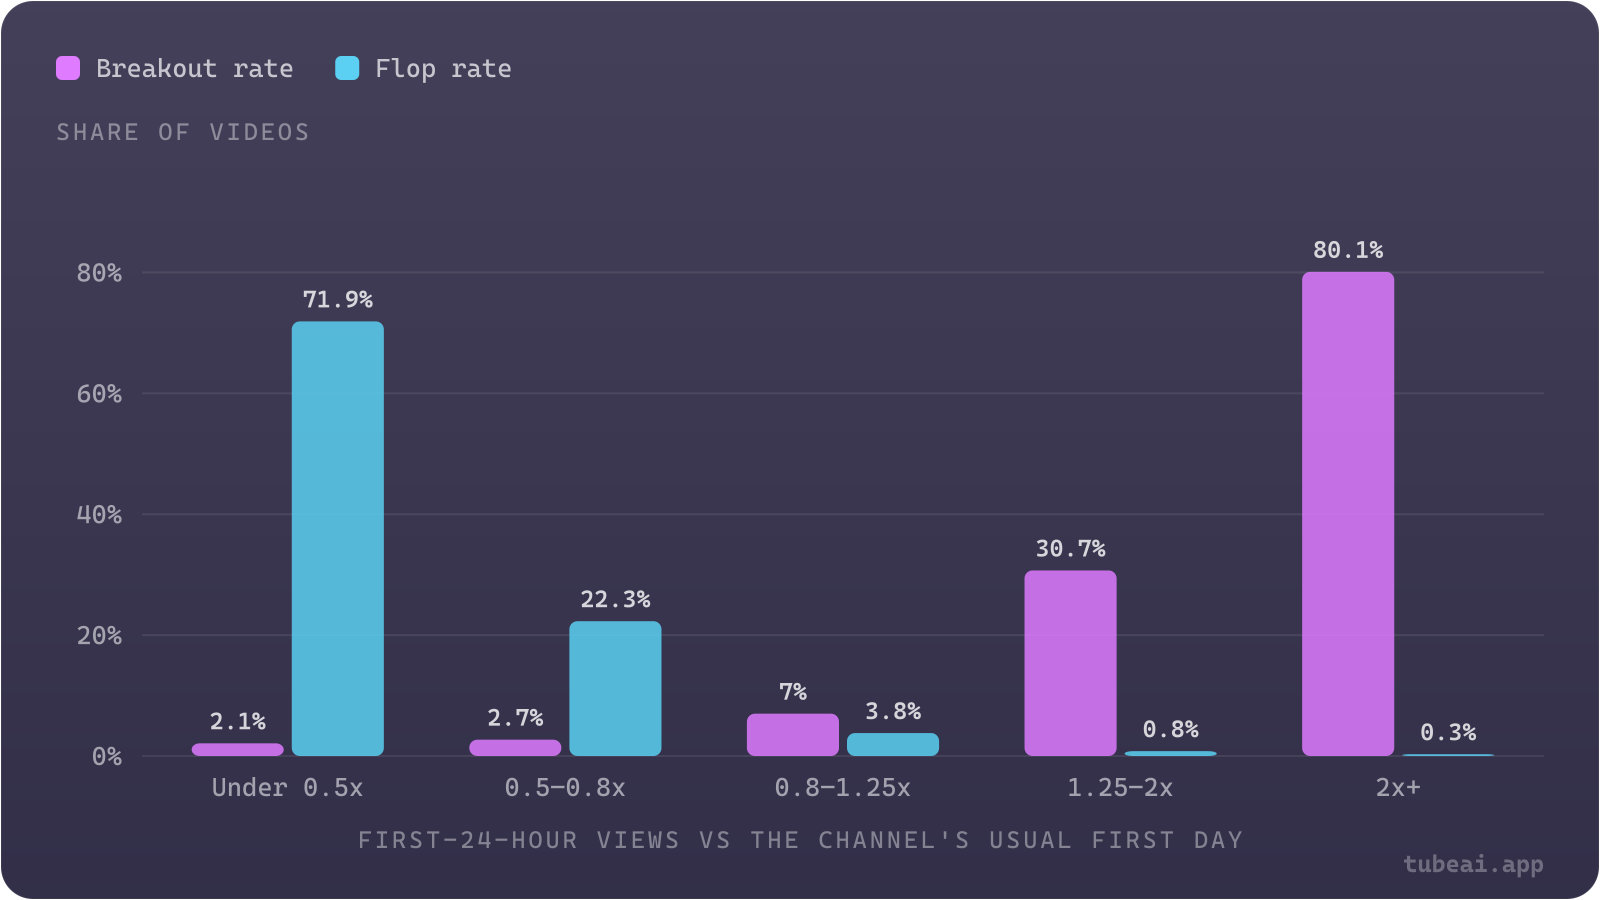
Chart data
| First-24-hour views vs the channel's usual first day | breakout_rate (%) | flop_rate (%) |
|---|---|---|
| Under 0.5x | 2.1 | 71.9 |
| 0.5–0.8x | 2.7 | 22.3 |
| 0.8–1.25x | 7 | 3.8 |
| 1.25–2x | 30.7 | 0.8 |
| 2x+ | 80.1 | 0.3 |
| First day vs channel's usual first day | Videos | Broke out | Flopped | Week-one views vs channel's usual week |
|---|---|---|---|---|
| Under 0.5x | 19,562 | 2.1% | 71.9% | 0.36x |
| 0.5–0.8x | 39,168 | 2.7% | 22.3% | 0.67x |
| 0.8–1.25x | 99,389 | 7.0% | 3.8% | 1.00x |
| 1.25–2x | 38,134 | 30.7% | 0.8% | 1.48x |
| 2x and more | 20,765 | 80.1% | 0.3% | 2.97x |
Day one is a strong signal. A video at twice its channel's usual first day ended its week at a median of 2.97x the channel's usual week, and 80.1% of those videos broke out. A video under half its usual first day ended at 0.36x, and 71.9% flopped.
But it is not a verdict. Adding up the rows, about 23% of the breakouts in this group started at or below their channel's normal first-day pace and found their audience later. Those are exactly the back-loaded videos in the curve above. If you judge a video at hour 24 and give up on it, you will sometimes give up on the one that was about to take off.
- 47.9%of 14-day views by day 1
- 77.3%by day 3
- 93.3%by day 7
- 90.2%by day 7, breakouts only
Does a video keep getting views after the first week?
A little. For the videos we kept reading daily after their first week, 93.3% of their 14-day views had already arrived by day 7, so week two adds about 7%. Breakouts again lean later: they had 90.2% of their 14-day views by day 7, against 93.7% for everything else. Evergreen search videos can keep collecting views for years, but on the typical upload the first week is most of what the next two weeks will show.
How to judge a new upload
Wait for the main wave
Do not read anything into the first 3 to 6 hours. Even strong videos have only a few percent of their week by then.
Compare with your own first day
At hour 24, divide the video's views by your channel's typical first-day views. That ratio says far more than the raw count.
Act on a clearly weak start
Under half your usual first day is the zone where most videos flop. That is the moment to test a new thumbnail, not after a week.
Do not write off an average start
Videos near your normal pace still broke out 7% of the time, mostly later in the week. Keep promoting them.
Judge the video at day 7
Most videos are about 93% done by day 7. Use the week-one number to compare uploads and plan the next one.
If you do change the packaging of a slow starter, our study of thumbnail swaps after publishing shows what those changes tend to do. Because view counts are the raw material here, it is also worth knowing how YouTube's new view count changed the numbers. And if you upload often, how often to upload affects how much room each video gets in its first days. Packaging that earns a strong first day starts with the title; our ranking of YouTube title formats is a good place to begin.
Frequently asked questions
How long does it take for a YouTube video to get views?
For most videos, about a day. The median long-form upload in our data got 54% of its first-week views in the first 24 hours and 84% by day three. Videos that break out are slower: they had 37% of their first week by hour 24 and kept growing all week.
Is the first hour important on YouTube?
Not much on its own. The median video had under 1% of its first-week views after one hour and about 9% after six hours. The main wave of views arrives between hour 6 and hour 24.
Is it true that the first 48 hours decide a video's success?
For most videos, mostly yes: typical videos had 74% of their first week by hour 48. But breakouts had only 56% by then, and about 1 in 4 breakouts started at or below their channel's normal first-day pace.
How do I know if my video is doing well after 24 hours?
Compare its first-day views with your channel's usual first day. In our data, videos at 2x their usual first day broke out 80.1% of the time, while videos under half of it flopped 71.9% of the time.
Do YouTube videos keep getting views after a week?
Some, but usually not many. Videos we followed to day 14 had 93.3% of their 14-day views by day 7. Breakouts kept going a bit longer, with 90.2% by day 7.